Executive summary
What happened
On Saturday 30 May 2020, V/Line train 8185 was operating as the 2216 evening service from Melbourne’s Southern Cross Station to Wendouree in suburban Ballarat. The train was a three-car VLocity Diesel Multiple Unit (DMU).
The service was scheduled to stop at Ballarat Railway Station in central Ballarat before proceeding to its destination at Wendouree. The station was located a short distance before the Lydiard Street North level crossing that was fitted with heritage swing gates.
Approaching Ballarat Railway Station, the train did not respond to the driver’s braking demands and could not be stopped. At about 2336, the train passed through the station and impacted the level crossing gates that were closed to rail traffic. The train was estimated to be travelling at between 93 and 97 km/h at the time of the collision.
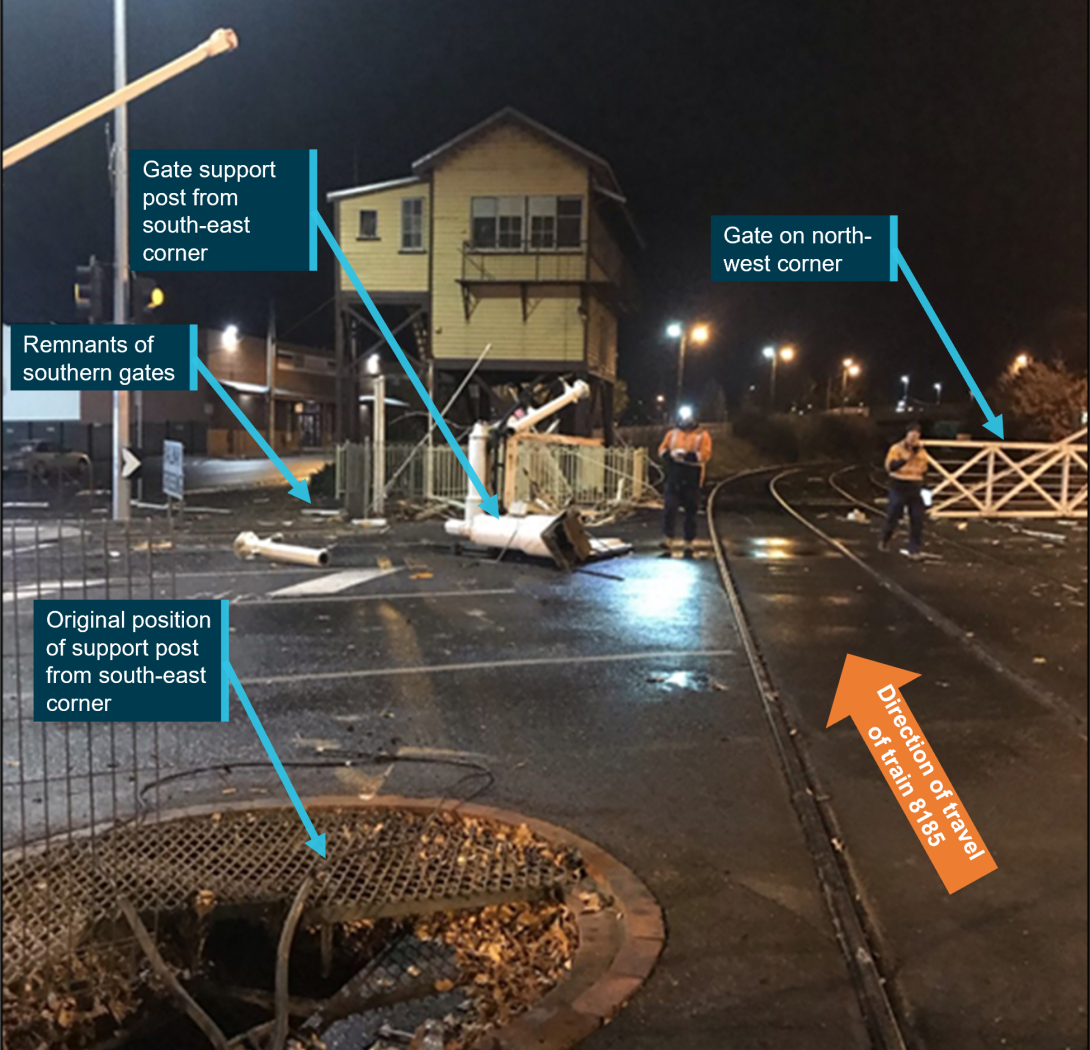
The impact destroyed the pair of southern gates, damaged the front and side of the train, and resulted in gate debris being scattered into the surrounding area. There were no injuries to members of the public from this debris.
The driver subsequently brought the train to a stand approximately 640 m beyond the station. One of the two passengers on board required hospitalisation, and the train driver and conductor sustained minor injuries.
What the ATSB found
It was found that slippery rail conditions existed for at least the final 2.5 km of the approach to Ballarat Railway Station and probably the final 5 km. It was concluded that moisture from light rain was the primary environmental factor influencing the formation of very low levels of adhesion[1] at the contact between the train’s wheels and the rail head. This substantially reduced the braking performance of train 8185.
It was found that the sanding system installed on train 8185 to improve adhesion in slippery conditions was ineffective at improving braking performance during this event. It was concluded that several factors potentially adversely influenced the effectiveness of the sanders.
The design configuration of the sanding system, and specifically the locating of the sanding nozzles behind wheels, was not consistent with the current design practice of locating sanding nozzles ahead of the wheel-rail interface being targeted.
It was also found that there were missed opportunities to identify weaknesses in the sander design configuration. Operator acceptance of the three-car VLocity braking system did not include assessment of sander performance against defined criteria for improving adhesion. In addition, V/Line investigation of previous rail safety occurrences that involved poor wheel-rail adhesion did not examine sander effectiveness.
Other factors that increased the risk of diminished sander performance included vegetation contamination in sander mechanisms that reduced sand flow, and the depletion of sand in one sand box. These factors were associated with sander maintenance and train preparation processes. It was also noted that the strong crosswinds present that evening may have adversely influenced sand distribution.
Loss of adhesion leading to increased stopping distance was not recognised as a risk source for collision in V/Line’s risk registers. It was concluded that there were insufficient risk controls in place to mitigate against a train arriving at Ballarat Railway Station travelling at excessive speed and being unable to stop before impacting the Lydiard Street North level crossing gates.
The configuration of the crossing protection that used swing gates introduced additional hazards compared to boom barrier style crossing protection and risk controls were not in place to manage the unique risks that existed at the crossing.
What has been done as a result
V/Line has advised the ATSB of the following safety actions that address five of the identified safety issues:
- Sanders have been installed on the intermediate cars of VLocity three-car sets. The added units discharge sand in front of the wheel-rail contact point (in the direction of travel) and are operational on all VLocity trains.
- A sand flow test has been added to the VLocity servicing schedule to monitor through-life sander discharge performance.
- The work instruction for checking sand boxes has been reviewed and will be updated to include enhanced guidance on required sand levels.
- A number of additional risk assessments have been undertaken in relation to loss of adhesion leading to increased stopping distance.
- To enhance risk controls associated with the Lydiard Street level crossing, V/Line has reduced the permitted train speed on the approaches to Ballarat Railway Station from 160 to 80 km/h. Boom barrier level crossing protection has been installed at the Lydiard Street North level crossing and speed monitoring has been installed at the Humffray Street level crossing to initiate activation of the Lydiard Street North level crossing protection in the case of a train travelling above the design threshold.
On the remaining safety issue, the Australian Transport Safety Bureau recommends that V/Line takes safety action to ensure the performance of sanders on the VLocity three-car set is assessed against defined acceptance criteria for improved braking performance in low adhesion conditions.
Safety message
This occurrence has highlighted the importance of passenger rail operators having risk controls in place to prevent collisions because of slippery rail conditions. Controls include effective train-borne equipment such as wheel slip/slide protection systems and sanders, and targeted risk controls at locations vulnerable to risks associated with train overrun.
The occurrence
Journey before incident
On Saturday 30 May 2020, V/Line[1] train 8185 departed Melbourne’s Southern Cross Station at its scheduled time of 2216[2] travelling to Wendouree in suburban Ballarat. The train stopped at several stations en-route to Ballarat, including Ballan about 36 km to the east. At about 2318 on the approach to Ballan, train 8185 experienced wheel slide[3] during braking but was able to stop at the station. The driver observed light rain and gusty winds at this time.
Figure 1: Rail route from Melbourne to Ballarat and Wendouree
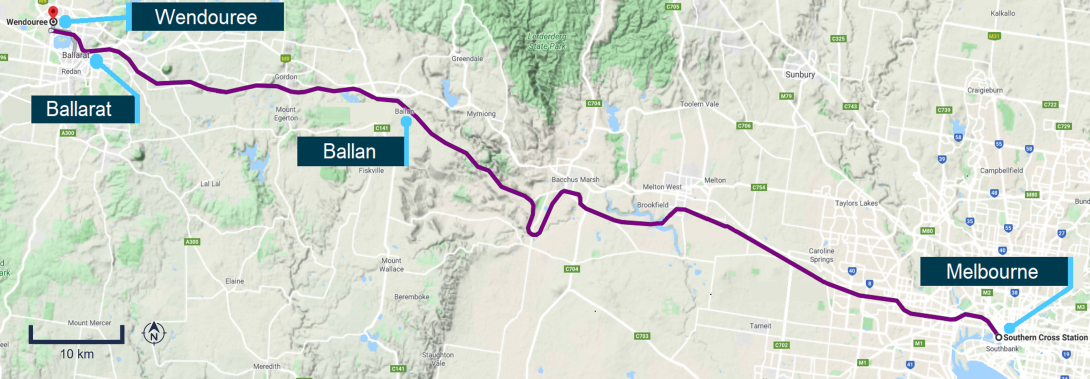
Source: Google Maps. Annotated by Chief Investigator, Transport Safety (CITS)
Departing Ballan, the driver experienced wheel slip[4] events during the next 12 km when powering and, as the journey progressed, instances of wheel slide during braking. The train’s event recorder detected that the wheel slip/slide protection (WSP) system was active for about 75 per cent of the time in the first 5 km after departing Ballan. The WSP train system is activated automatically to assist management of wheel slip and slide in slippery conditions.
The incident
The driver reported that they commenced braking slightly earlier than they normally would on the approach to Ballarat due to the wet and windy weather conditions. The train’s event recorder detected braking being initiated at 23:33:44, approximately 5.1 km from the intended stopping point at Ballarat Railway Station. Train logger information indicated that the train was travelling at just over 160 km/h.
Over about 650 m, the brake was applied, then released and then reapplied. During these early brake applications, the train’s WSP system detected wheel slide, which was followed by activation of the sanding system. The brake was again released at 23:34:04, with the train about 4.3 km from the intended stopping point and estimated to be travelling at between 150 and 155 km/h.[5]
The train then coasted for 22 s, after which the driver made a further brake application. At this point, the train was approximately 3.4 km from its intended stopping point at Ballarat Railway Station and travelling at approximately 160 km/h. Four seconds later, the train’s WSP and sanding systems were activated by the braking system.[6]
When about 2.6 km from the train’s intended stopping point, the driver increased braking to a full-service brake application. The full-service braking was then maintained except for a short reduction in brake demand for between 3 and 4 s when the train was about 1.5 km from the station. Under full-service braking, the speed of the train was reducing at an average rate of about 0.2 m/s2 compared to the design rate of 0.95 m/s2 in dry conditions.
About 730 m from the intended stop at Ballarat Railway Station, the train passed over Humffray Street North level crossing and estimated to be travelling at between 120 and 125 km/h. The flashing lights, bells and boom barriers were all operating when the train passed through the crossing but with reduced warning time.[7] Seven seconds after passing over the crossing, and probably travelling at between 110 and 119 km/h, the train passed through a set of facing points (number 39 points) and associated turnout that were speed limited to 40 km/h, and onto the southern track that led to platform 1 at Ballarat Railway Station.
At 23:35:49, and now about 300 m from the intended stopping point, the driver moved the brake controller from a full-service to an emergency brake application. The train entered the station travelling at about 100 km/h.
The train passed its intended stopping point at the western end of Ballarat Railway Station at 23:35:59, travelled through departure signal 20 that was at stop, and entered the Lydiard Street North level crossing at a speed estimated to be between 93 and 97 km/h (Figure 2).
Figure 2: Train 8185 having impacted the first gate and about to strike the second.
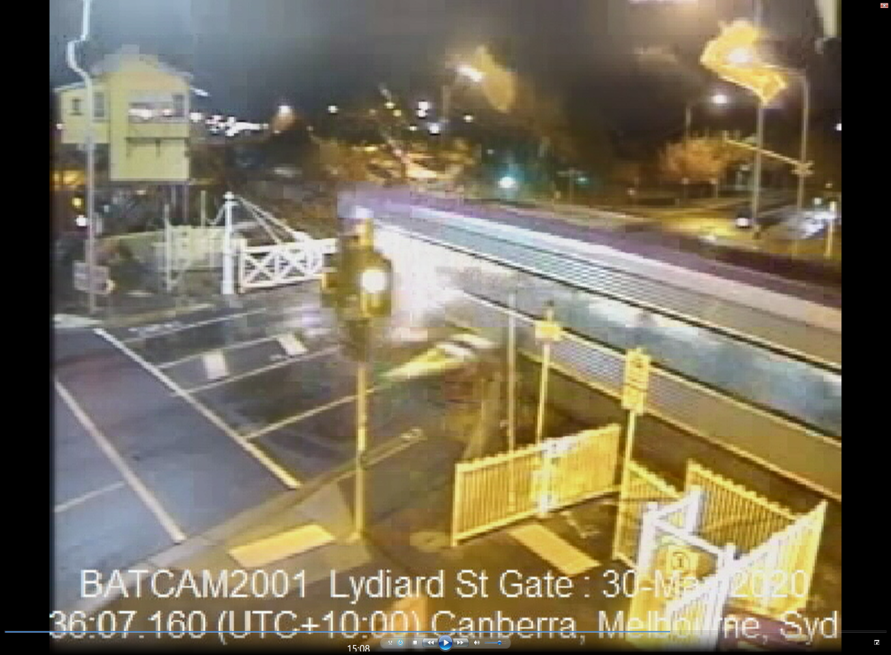
CCTV snapshot of train having entered the level crossing traveling from right to left.
Source: V/Line Corporation
About a second before the train passed through the crossing, the road traffic lights changed from green to flashing amber as the train occupied a track circuit[8] for the crossing. However, the gates were still across the railway track rather than protecting the crossing from road traffic and were struck by the train. CCTV had recorded a group of three pedestrians walking across the level crossing approximately 49 s before the train passed across Lydiard Street North.
The train continued westwards, through a set of trailing points that were also speed limited to 40 km/h. It then passed over the Doveton Street North level crossing that was about 400 m after its intended stopping point. The flashing lights, bells and boom barriers were operating when the train passed through the crossing, but with reduced warning time. The train came to a stand about 640 m beyond its intended stop.
Following the incident
After stopping, the driver communicated with the V/Line regional train control centre (Centrol) to report the incident and arrange for an emergency response. The conductor, who had been in the rear driver’s cab, moved forward along the train and checked on the two passengers in the front carriage before checking on the driver.
The passengers and crew had been subjected to lateral forces (rough ride) as the train negotiated the series of turnouts. One passenger had been standing near an exit door as the train approached the station. This person sustained head, back, and leg injuries and was taken to hospital by emergency services. The other passenger had been seated and indicated to the conductor that they were uninjured.
Once the passengers were detrained, the conductor was also taken to hospital for assessment before being discharged. The driver of the train sustained minor injuries.
Collision damage to train 8185
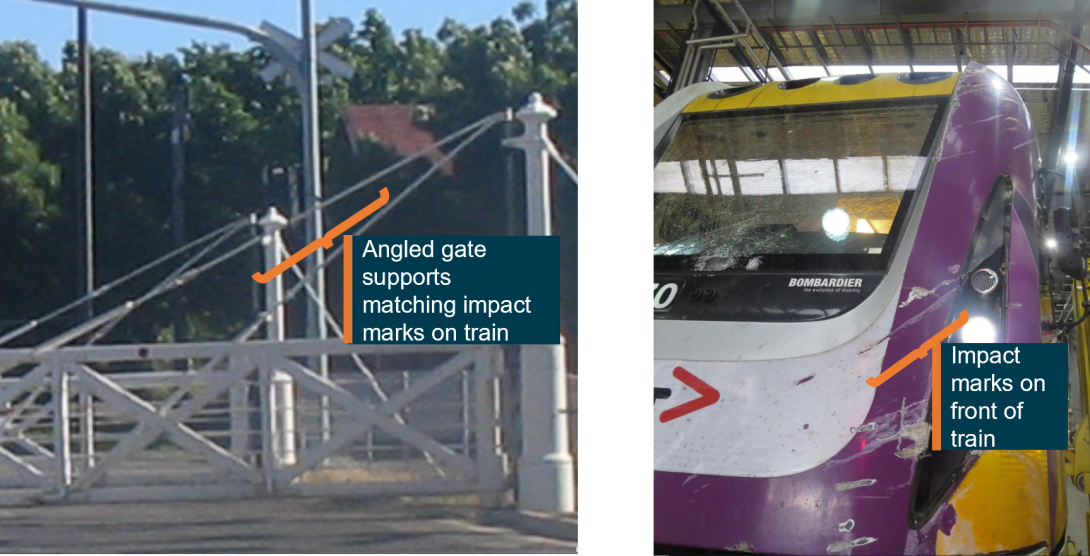
The front of the lead car (1270) was significantly damaged as a result of impact with the heritage gates. The driver’s cab survival space was maintained and the windscreen was not penetrated.[9] Impact marks on train front were consistent with portions of the gate support (Figure 3).
Figure 3: Impact damage to the front of train 8185, car 1270
Source: CITS
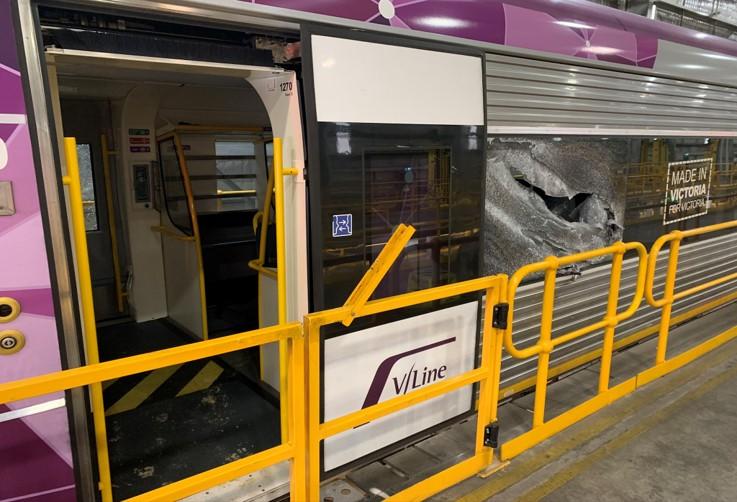
Part of the gates impacted the left side of the leading car, penetrating the side window surface (Figure 4).[10] The internal fittings remained intact.
Figure 4: VLocity car 1270 impact damage to passenger (left) side leading window
Source: CITS
Level crossing gate damage from collision
Train 8185 was travelling on the southern-most track when it passed through the Lydiard Street North level crossing with the gates closed to rail traffic. The train struck and destroyed the southern-side pair of gates (Figure 5). Parts of the gates were reported to have impacted adjacent buildings. The gates on the northern side of the crossing remained attached to their support posts.
Figure 5: Remnants of the damaged gates on the southern side of the crossing
Source: V/Line
Context
Location
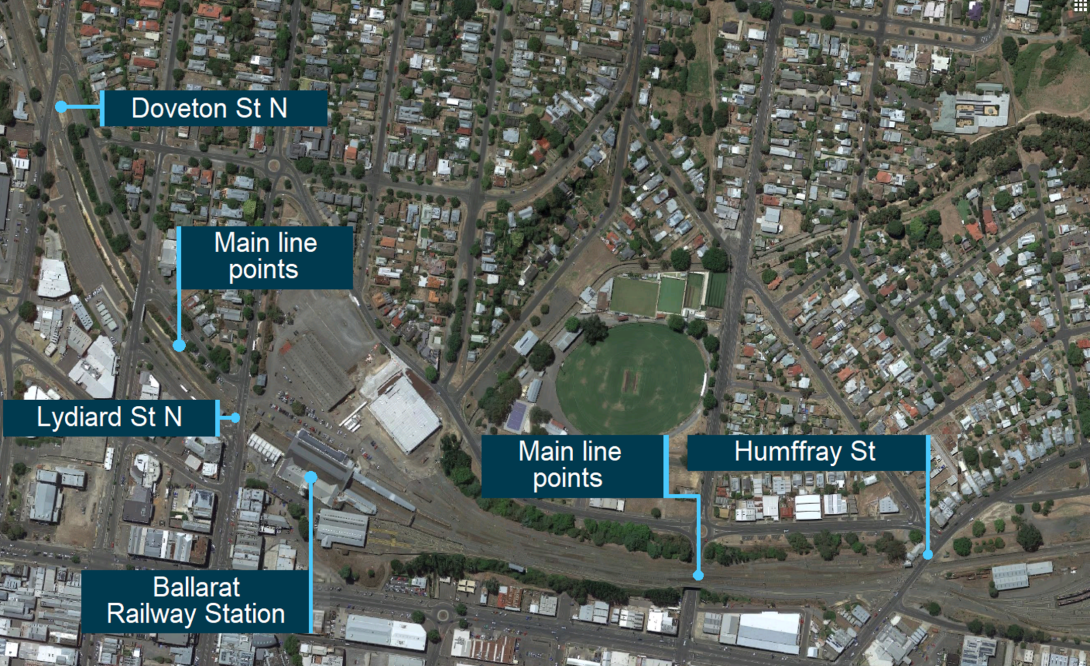
The incident occurred in Ballarat, a Victorian regional city located about 100 km west of Melbourne. Ballarat Railway Station is the main station within Ballarat, and is located adjacent to Lydiard Street North (Figure 6).
Figure 6: Ballarat Railway Station locality and level crossings
Source: Google Maps. Annotated by CITS
Environmental conditions
The Bureau of Meteorology (BoM) weather monitoring station was located at Ballarat Aerodrome, about 8 km from Ballarat Railway Station. The BoM station recorded an air temperature of 9.0 °C and a relative humidity of 90 per cent at 2330 on the 30 May 2020.
Light rain was recorded between 2300 and 2330 on the evening of the incident, registering a total fall of 0.2 mm. The previous recorded rain fall was at around 0300 in the early hours of that day, when 0.2 mm precipitation was also recorded at the BoM station. After the incident, there was no further rain recorded prior to the departure of the first train the following morning.
At 2330, wind was recorded by the BoM as being from the north at 33 km/h, gusting to 42 km/h. The potential for the presence of airborne particulates was considered. The nearest Environmental Protection Agency (EPA) testing station that was recording on the day of the incident was in suburban Melbourne, about 95 km from Ballarat. Data recorded by the EPA showed no significant increase in PM10 particles[11] in Victoria on the day of the incident.
Track information
Track and associated infrastructure were owned by the Victorian Rail Track Corporation (VicTrack) and managed by V/Line Corporation (V/Line). V/Line was responsible for track maintenance.
Track construction and corridor environment
Ballarat is linked to Melbourne and other regional centres by the regional rail network. The track from Deer Park Junction in western suburban Melbourne to around 2 km from Ballarat Railway Station was Class 1 (allowing a maximum speed of 160 km/h) and constructed on concrete sleepers. This track was upgraded as part of Victoria’s Regional Fast Rail (RFR) project that was completed in 2006. The gauge of the RFR upgraded track approaching Ballarat was, on average, about 7 mm narrower than the nominal 1600 mm broad gauge.[12] About 2 km from Ballarat Railway Station the line speed reduced from 160 km/h to 130 km/h. Track construction from this point was a mixture of concrete and wooden sleepers.
Between 6 km to 1 km from the station, the rail corridor was predominantly contained within a shallow cutting. There was a mix of trees, shrubs, and grass in the rail corridor in this area.
Track gradient
From about 6.5 km, the track approaching Ballarat Railway Station was on an approximate 1:52 downgrade. The gradient eased to approximately 1:100 downgrade between 1 km and 2 km from the station, then changed in the vicinity of Humffray Street North to a slightly uphill grade of 1:737. Approximately level track immediately preceded the station, with a slight rising grade of 1:383 recorded along the platform. On leaving Ballarat Railway Station, there was an uphill gradient of approximately 1:71 in the vicinity of Doveton Street.
Signalling Information
V/Line was responsible for the operation and maintenance of the signalling system.
The signalling at Ballarat was operated from the Centrol train control facility in Melbourne. Centrol interfaced with signal interlocking at Ballarat to provide remote monitoring and control. The area was equipped with three aspect colour light signalling.
Signals 52 and 40 on the approach to Ballarat were equipped with Train Protection and Warning System (TPWS) Train Stop Sensors (TSS)[13] that would have applied the train’s brakes if either of these signals had been passed at stop. In this instance, both signals were at proceed and therefore the TSS was not triggered. The TPWS at this location was not fitted with an overspeed sensor (OSS) that initiates a train emergency brake application if a train is detected as being overspeed.
Signal 40 at Ballarat was located before facing points[14] (39 points) that were set to direct the train to platform 1. The speed limit across these points and turnout was 40 km/h.
Train route and signal status recording
Centrol train control had set the route for train 8185 to Ballarat Railway Station. From signal 52, located about 1 km from the station, the route was set to take the train into platform 1 up to signal 20 (Figure 7). Signal 52 displayed a yellow over green aspect, requiring the train to reduce to medium speed (40 km/h) for signal 40, that was located approximately 500 m from the station.
Figure 7: The route set for and taken by train 8185 at Ballarat

The green line indicates that the route had been set and cleared for train 8185 through to signal 20.
Source: V/Line, annotated by CITS
Lydiard Street North level crossing
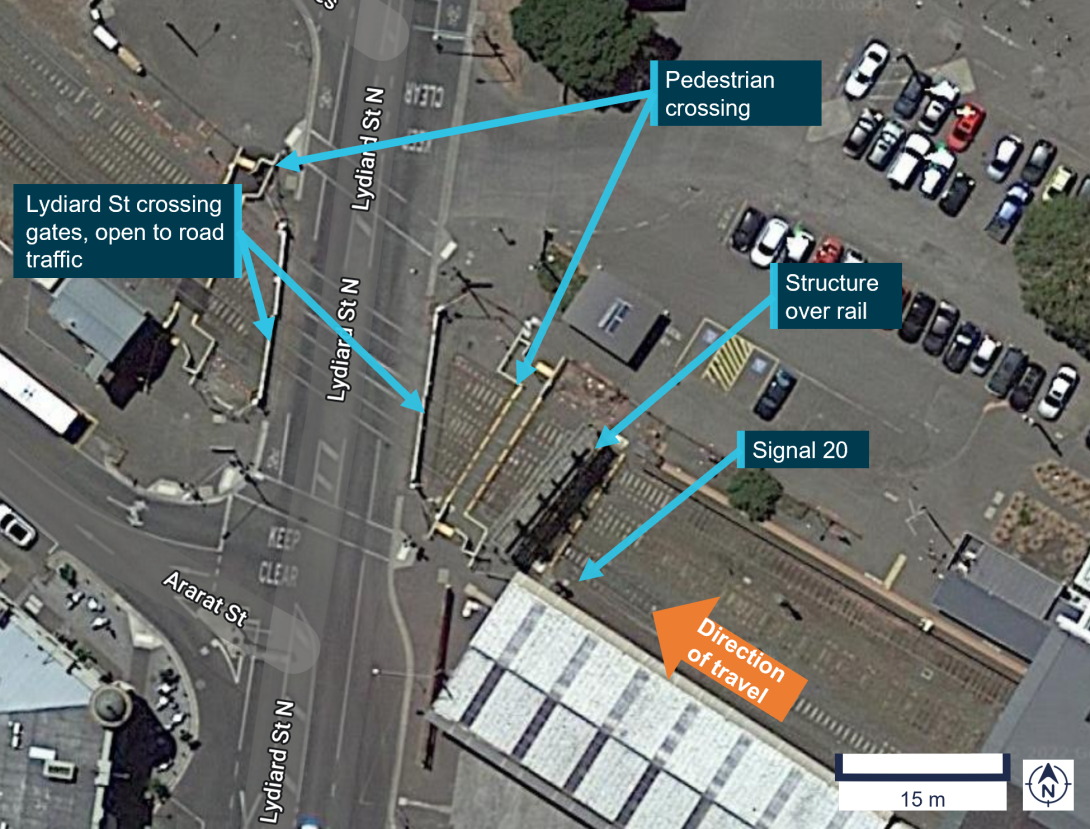
The level crossing over Lydiard Street North was immediately adjacent to the west end of the Ballarat Railway Station platforms and located at a chainage of 113.923 rail km from Melbourne (Figure 8).
Source: Google Maps. Annotated by CITS
A set of swing gates were installed on either side of the rail corridor (Figure 9). The gates were first installed in 1885, and were a heritage-listed element of the preserved station precinct.
Figure 9: Level crossing gates at Lydiard Street North, approaching from the south

Source: Pass Assets - Department of Transport (Vic)
The mechanism to operate the gates was replaced by a motorised system in 2001.[15] When required to permit the passage of rail traffic, the gates were motored closed to road traffic. Further modification was made in 2017 when the pedestrian crossing gates were upgraded to include emergency gate control locks. Road traffic lights also protected the rail crossing. The road manager was the City of Ballarat.
Control of gates
The Lydiard Street level crossing gates were controlled from a signal box at Ballarat until 2016, when control was transferred to the Centrol train control facility in Melbourne. The crossing was equipped with CCTV to assist with this remote operation.
When the level crossing was closed to rail traffic (normal position), departure signals at the station for westbound traffic were set to stop (red aspect over a red aspect). Signal 20, the departure signal for platform 1, was one of three down[16] departure signals located at the west end of Ballarat Railway Station that were similarly interlocked with the gates.
To operate the gates so that they opened for rail traffic, the train controller (at Centrol) moved an on-screen icon from ‘normal’ to ‘reverse’ in the display of the train control system. This resulted in the road traffic lights on either side of the crossing changing to red, stopping road traffic. The train controller was then able to close the gates to road traffic by remote control of the motorised system.
With the gates confirmed closed to road traffic, the train controller would then set the relevant departure signal to a proceed indication, permitting the train to depart towards Wendouree.
Train crew and passengers
The driver
The driver of train 8185 had more than 46 years driving experience. They had been driving VLocity DMU since they were introduced into service in 2005.
In the four months leading up to the incident, the driver worked 23 shifts,11 of which were VLocity runs from Southern Cross Station to either Ballarat or Wendouree. Of these 11 trips, five were with three-car sets and six with six-car sets.
The driver’s last annual Train Driver Safety Audit was conducted in September 2019 with no detected non-conformances, and their most recent periodical medical was completed in February 2020, from which they were assessed as fit for duty.
The driver suffered minor injuries as a result of this incident.
Driver roster and fatigue
The previous 14 days rostering would not have contributed to a fatigue condition. The driver did not work for 10 of the 14 days preceding the incident. That last work day was 29 May 2020 where they worked an 8 hour shift to 2309.
There was no evidence to suggest that the driver’s shift on the day of the incident had led to fatigue being a factor in this incident. On that day, the driver commenced duty at 1700 and first ran a VLocity service from Ballarat to Melbourne, experiencing no operational issues. Arriving at Southern Cross Station, they changed platforms to access train 8185 for the return trip to Wendouree.
There were no other indicators or conditions identified that suggested driver fatigue was a factor in this incident.
The conductor
The conductor signed on for duty at 1406 on the day of the incident and was completing their fourth and final run of the day when the incident occurred. The conductor was travelling in the rear cab of the train as it approached Ballarat. After the incident, they moved to the front of the train to assist the passengers and driver. The conductor received minor injuries and attended hospital for assessment.
Passengers
There were two passengers on board at the time of the incident. The train had fewer passengers than would otherwise be expected owing to movement restrictions associated with the Covid-19 pandemic. One of the passengers was taken to hospital for treatment following the incident.
Train 8185
Car-set 3VL70
Train 8185 comprised the three-car VLocity Diesel Multiple Unit (DMU) set 3VL70. In the direction of travel towards Ballarat, the set consisted of car DM1270 (a powered car with driving cab), TM1370 (a powered intermediate car), and DM(D)1170 (a powered car with driving cab).
Car-set 3VL70 was purchased as a three-car unit and entered service in 2017. The VLocity type train was designed, manufactured, and maintained by Bombardier Australia.[17] VLocity trains were originally introduced to the Victorian broad gauge network as two-car sets in 2005. In 2006, three-car units were ordered and additional intermediate (TM) cars procured to insert into the existing two-car units. VLocity trains were subsequently operated as three-car and six-car sets.
The three-car VLocity operated to a maximum speed of 160 km/h. Traction power was provided by a diesel engine under each vehicle, driving the cab-end bogie of the DM and DM(D) cars, and the rear bogie of the intermediate TM car, in the direction of travel for train set 3VL70 travelling from Melbourne to Ballarat. Tractive force was delivered from the engine via a hydrodynamic transmission.
Train 8185 on day of incident
On the morning of 30 May, train set 3VL70 received its primary preparation at Geelong.[18] The preparation was recorded on a Vehicle Preparation Form and no train faults were detected during the preparation. The primary preparation included checking sand boxes that supplied sand for braking in slippery conditions. The process did not include objective criteria for the assessment of adequate sand level, and there was no checklist of individual items completed by the preparation driver as part of this task.
The driver of train 8185 joined the train at Southern Cross Station. The driver reported that on joining the train, they were not aware of any faults with the train. There was no opportunity nor responsibility on the driver to check sand levels at this point in the day.
Event recorder information
Train 8185
The VLocity was equipped with a Faiveley Transport VM-40 event recorder that logged 40 digital inputs with an additional four internal state digital signals, 11 analogue inputs and eight other channels from the VLocity subsystems and equipment. The logger recorded key information including driver power and brake controller demand, braking system activity and train location and time from an on-board GPS receiver.
Information on train speed
Two values of speed were logged by car 1270, pulse speed and BCU speed:
- Pulse speed was calculated from the rotating speed of the third axle from the leading end of car 1270 and was also the input to the speedometer display. If this wheelset was sliding during braking, the pulse speed was an underestimate of the speed of the train.
- Brake Control Unit (BCU) speed was calculated (when in braking) from the rotating speed of the fastest rotating axle on car 1270. During a slide event, it was more accurate than pulse speed because it was using information from the wheelset with the least slide (fastest rotating). None-the-less, it could also be an underestimate of the train’s speed during wheel slide.
Both the pulse and BCU speeds underestimated actual train speed during periods when wheels were sliding. Graphed pulse and BCU speeds tended to be saw-tooth in shape (Appendix E, Figure 34), with wheelsets slowing sharply during brake application with slide, and then returning towards actual speed when braking was automatically released to reduce the sliding.
Driver braking and train speed on the approach to Ballarat
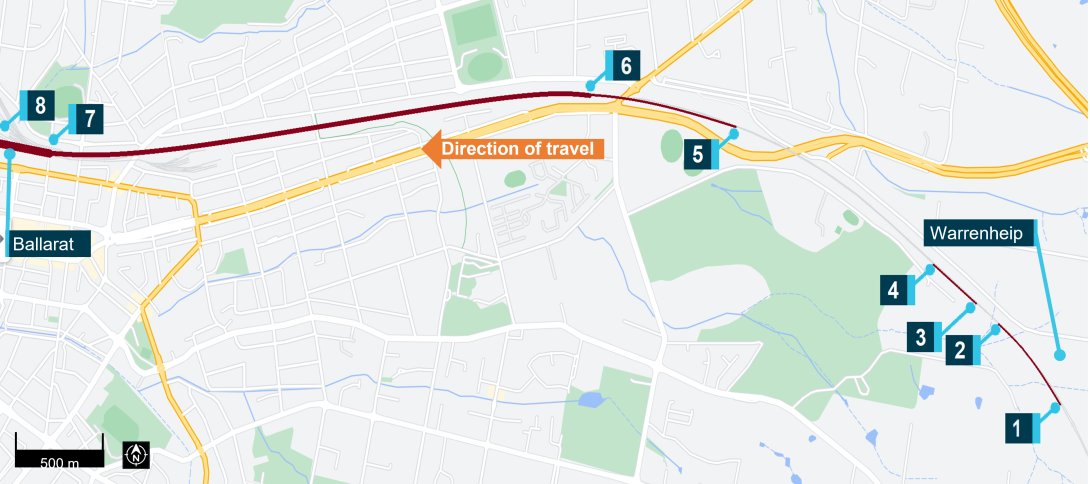
The event recorder showed that the driver of train 8185 engaged in three distinct periods of brake application on approach to Ballarat Railway Station (Figure 10 and Table 1).
Figure 10: Locations of brake applications of train 8185 on Ballarat approach
Source: V/Line, Google Maps, annotated by CITS
Table 1: Brake application points, with recorded speeds and an estimated speed
| Time | Event |
Pulse speed (km/h) |
BCU speed (km/h) |
Estimated train speed [1] (km/h) |
| 23:33;21 | Power and braking off, train coasting | 158 | 158 | 156 – 158 |
| 23:33:44 | Position 1 Braking commenced | 163 | 164 | 161 – 164 |
| 23:33:56 | Position 2 Braking released for 1s | 162 | 163 | 160 – 163 |
| 23:33:57 | Position 3 Braking reapplied | 161 | 163 | 160 – 163 |
| 23:34:04 | Position 4 Braking released for 22 s | 132 | 140 | 150 – 158 |
| 23:34:26 | Position 5 Braking reapplied | 161 | 162 | 160 – 162 |
| 23:34:43 | Position 6 Full-service brake application | 155 | 158 | 155 – 159 |
| 23:35:09 | Brake demand reduced to 30% for 3-4 s | 98 | 127 | 134 – 136 |
| 23:35:12 | Return to full-service brake application | 110 | 135 | 133 - 136 |
| 23:35:35 | Train passes over Humffray St crossing | 97 | 117 | 120 - 125 |
| 23:35:42 | Train passes through 39 points | 94 | 107 | 110 – 119 |
| 23:35:49 | Position 7 Emergency brake application | 78 | 99 | 108 – 113 |
| 23:35:59 | Position 8 passes intended stop | 98 | 99 | 96 – 100 |
| 23:36:01 | Train enters level crossing | 75 | 93 | 93 - 97 |
| 23:36:37 | Train comes to stand | 0 | 0 | 0 |
[1] Given the potential underestimate of the recorded pulse and BCU speeds during wheel slide, an estimate of the speed range in which the actual train’s speed would probably lie was made using the logger GPS data. The GPS data was not sufficiently accurate to give instantaneous speeds and estimates were limited to an average over a period. All speeds are therefore estimates only. Source: Pulse and BCU speeds from train data logger. Speed estimate by CITS, using available logger data including GPS.
A graphical representation of the brake demand shows the first two braking periods, followed by the 22 s period of no braking, and then the continuous braking through to the collision (Figure 11). The term ‘brake demand’ refers to the total (load compensated) braking request transmitted from the brake control unit that is converted to a brake cylinder pressure. The range of brake demand was between 0 and 64 kN.[19]
Figure 11: BCU speed[20] and brake demands from the intended stopping point
![BCU speed[20] and brake demands from the intended stopping point](/sites/default/files/styles/wide/public/2022-11/RO-2020-007%20Figure%2011.png?itok=PA-0-Lwc)
This graph is drawn from train data logger records. There is some inaccuracy in logged distance information during the sliding event, in addition to the known limitations of the BCU speed. Source: CITS, from VLocity event recorder data
First period of brake application (from position 1 to 2)
At around 6 km from Ballarat Railway Station, the driver shut off power and commenced coasting. When approximately 5.1 km[21] from the station (position 1), the driver-initiated brake demand of 13 per cent of a full-service application.[22] This brake application was held for 13 s, during which the train travelled about 530 m. At the point of brake release (position 2), the train was approximately 4.6 km from the station.
Second period of brake application (from position 3 to 4)
Following about a second of brake release, a brake demand of about 70 per cent of full-service was commenced (position 3), before being eased to about 47 per cent. This second period of brake application lasted for 6 s, with a maximum brake cylinder pressure of 174 kPa[23] being recorded for the power bogie on car 1270. The driver released the brakes (position 4) when the train was approximately 4.3 km from the intended stopping point.
Third period of brake application (from position 5 to collision)[24]
After coasting for approximately 22 s, a third period of brake application commenced (position 5). The train was about 3.4 km from the intended stopping point. The initial brake demand was about 13 per cent of full-service. Then, with the train about 2.6 km from the station stop (position 6), the brake application was increased to full-service (100 per cent), that produced an average brake cylinder pressure of around 297 kPa over the next 66 s. At one point, the brake demand was briefly reduced (for about 3 s) to 30 per cent before being increased back to full-service when the train was about 1.5 km from the station.
With the train approximately 300 m from its intended stopping point, the driver moved from full-service to an emergency brake application (position 7).[25] The emergency braking was maintained as the train passed its intended stopping point at Ballarat Railway Station (position 8), collided with the crossing gates and subsequently came to a stop.
Wheel slip/slide protection (WSP) and sanding activity
The train was fitted with wheel slip/slide protection (WSP) and sanding systems to manage traction and braking in slippery rail conditions (refer braking system description). During all three described periods of braking on the approach to Ballarat, the WSP and sander systems automatically activated (Figure 12).[26]
Figure 12: Graph of event recorder information from car 1270 of train 8185
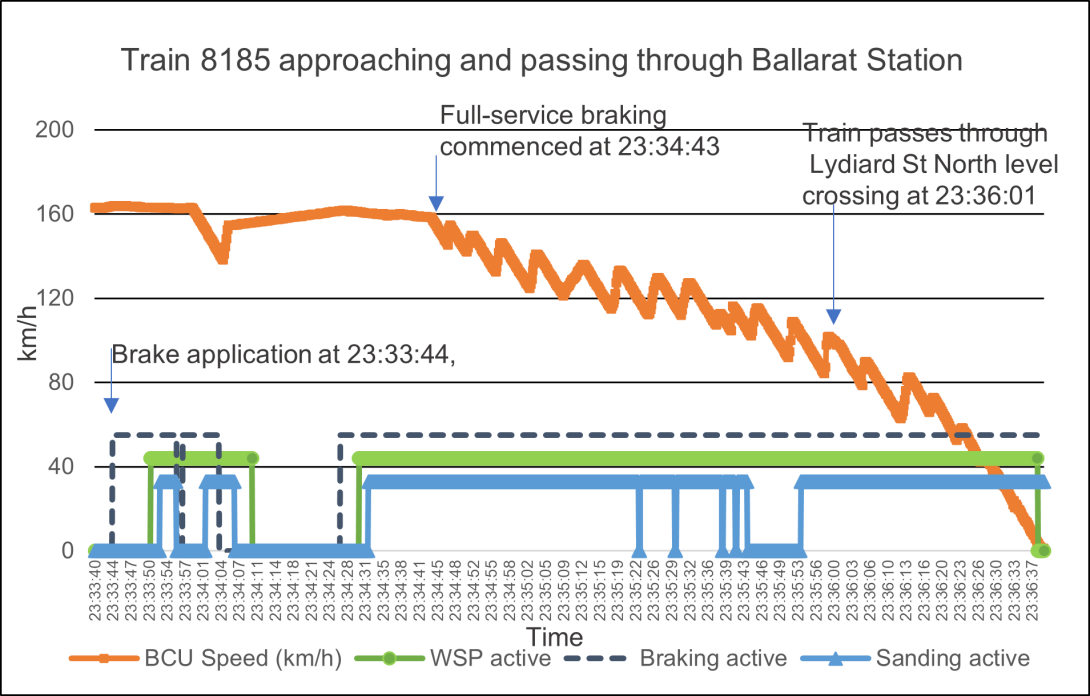
The figure shows WSP and sanding activity through each phase of braking. It also shows the saw-tooth behaviour of the BCU speed in the periods of heavier braking, and in particular during the full-service application from 23:34:43. Source: CITS, from train 8185 car 1270 event recorder data
Trains operating before and after the occurrence
Data logger records were also examined for the trains operating prior to train 8185, and the first train departing Ballarat the next morning.
Train arriving at Ballarat before train 8185
The previous train to enter Ballarat left Southern Cross Station at 2052 and arrived at Ballarat Railway Station at 2214 (train 8181). This train did not experience any wheel slip or slide events on this journey. The event recorder did detect wheel slip and sanding as power was applied after the trip at about 2331, on the entrance to Ballarat East depot. This event was shortly before the arrival of train 8185 and after the light drizzle had commenced.
Train departing Ballarat prior to train 8185
Train 8174 left Ballarat Railway Station for Southern Cross Station at 2119 on the evening of the incident. The event recorder of this train detected 4 s of WSP activation on the approach to Ballan Station at 2134. The train was braking from 145 km/h when the WSP was recorded. The train stopped safely at Ballan Station.
Train departing Ballarat after train 8185
The first train departing Ballarat after train 8185 was on the following morning (train 8104). The train departed at 0615 and there had been no rain recorded since that on the evening of the incident. The event recorder detected a number of slip and slide events between Ballarat and Ballan, including WSP and sander activity. This suggested that conditions remained slippery the next morning, with moisture probably remaining on the rail head.
Post-incident wheel and rail inspections
Train wheels
Post-incident inspection of train 8185 wheels identified some markings. The wheels of the leading car (1270) exhibited some minor marks approximately 25 mm long around the flange root of the wheels (Figure 13). It could not be determined whether these were caused by the slide incident or a previous event.
Figure 13: Markings on the wheels of car 1270
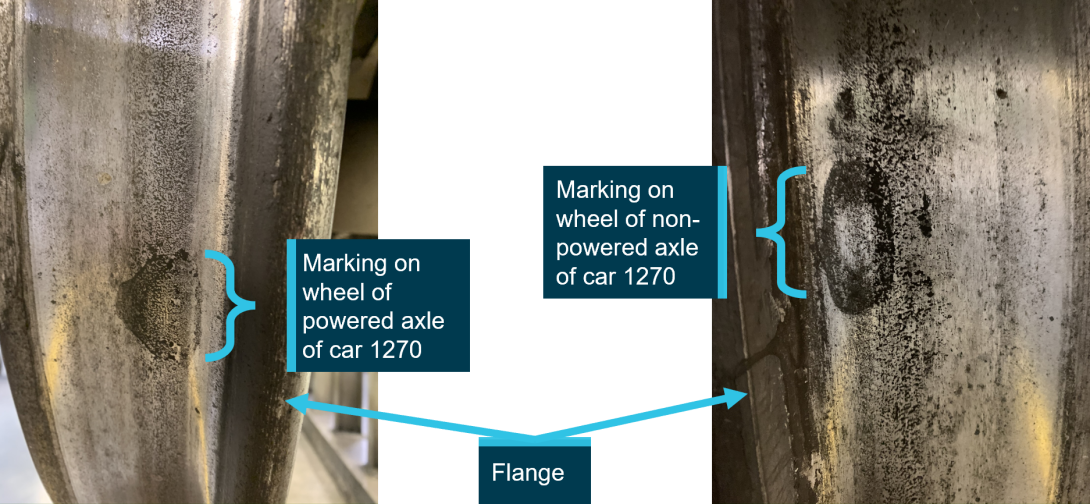
Source: CITS
Profile measurements of wheels on incident train 8185 were compared to the MP2[27] profile specified by V/Line. An assessment of the wheel profiles indicated that wheelset condition was consistent across the train and had no significant asymmetric wear, flange wear or tread wear. Analysis of wheel hollowing[28] provided by V/Line showed that measurements were within specification.
Track inspection and measurement
Monash Institute of Railway Technology (IRT) was engaged by V/Line to inspect the track during the day following the incident (IRT 2020). Inspections and measurements were at five sites, with three of those sites located on the approach side of Ballarat Railway Station (Figure 14). Site 1 was at the 110.243 km mark, site 2 at the 110.772 km mark, and site 3 at the 112.850 km mark.[29]
Figure 14: IRT measurement sites east of Ballarat Railway Station
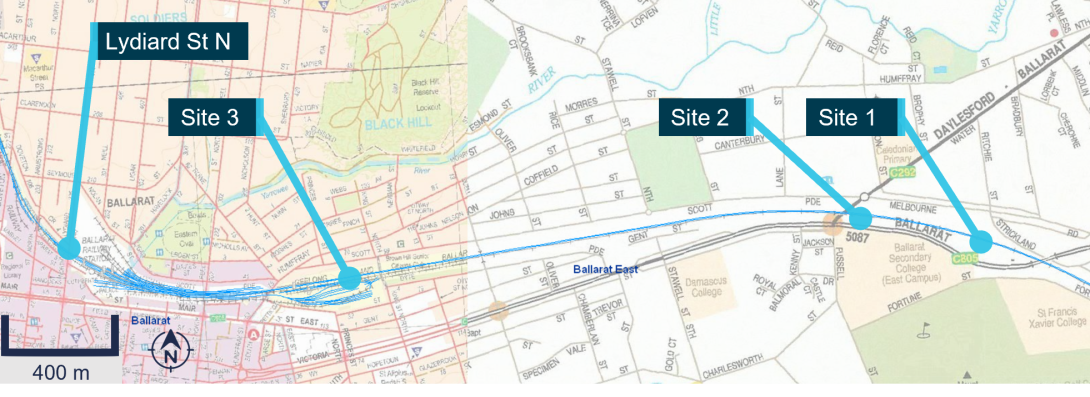
Source: Department of Transport (Vic) Pass Assets, CITS
Geometry
Track at sites 1 and 2 consisted of 60 kg rail on concrete sleepers, installed as part of the RFR project. There was also a track cant of approximately 75 mm[30] at these sites, consistent with the shallow radius left-hand curve of 2400 m radius. IRT concluded that rails at sites 1 and 2 were not significantly worn.
Site 3 was at the location of the older 94 lb/ft rail. The down rail showed significantly more wear than the up rail,[31] however transverse rail profiles were found to be close to the specified template.[32]
Rail head contamination inspection and assessment
IRT reported that the surface condition at sites 1 and 2 showed relatively typical levels of contamination, consistent with the presence of normal oxides and dust/dirt. More significant contamination was observed at site 3, with what appeared to be dirt/dust on the surface of the rails (Figure 15). The particulates on the rail head were not tested for composition.
Figure 15: Rail surface condition at 112.850 km chainage, about 1.1 km from station stop
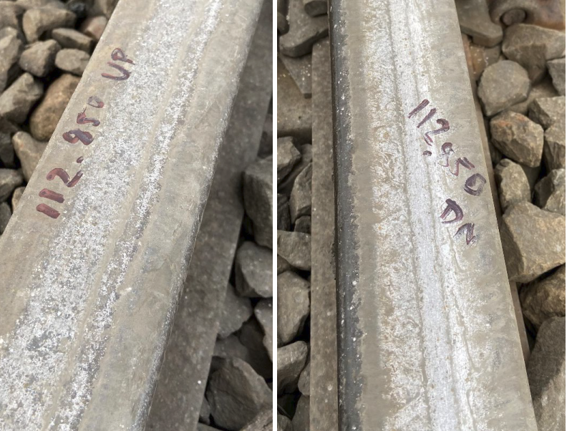
The figure shows some surface dust/dirt on the rail head and grease on the gauge corner of the down rail, the left rail looking towards Ballarat. The source of the dust/dirt is not known. Source: IRT (2020)
Grease was also observed on the gauge corner of the down rail at site 3, which was likely to have been carried from the wayside lubricator located approximately 150 m from this site in the direction of Ballarat Railway Station. The lubricant had not migrated onto the top of the rail where wheel contact was likely to have occurred.
Friction measurements
Measurement of the friction coefficient at the rail surface was undertaken by IRT the day after the incident using a push tribometer within the main wheel-rail contact band. Both dry and simulated wet conditions were measured, with wet conditions simulated by applying water to the rail surface using a conventional watering spray following the dry measurements.
Results showed that on the approach to Ballarat Railway Station between sites 1 and 3, friction conditions were relatively consistent. Dry rails recorded values between 0.42 and 0.47 (average 0.44). This figure reduced once water was applied, with results ranging between 0.28 to 0.33 (average 0.29).
IRT advised that adhesion levels decreased with increasing speed, and maximum friction levels for rolling stock travelling at 160 km/h might be expected to be 39 per cent less than that measured with the tribometer.[33] Based on this IRT reported figure of a 39 per cent reduction, the average measured wet coefficient of 0.29 would reduce to 0.18 at a train speed of 160 km/h.
Geometric analysis of wheel and rail contact
The effective management of the contact between wheels and rails is an important element of railway operations. ATSB undertook a geometric analysis[34] of the likely wheel rail contact conditions present for train 8185 at sites 1-3. A track gauge of 1593 mm was used for site 1 and 2, reflecting the narrower gauge on the RFR section, and 1600 mm was used for site 3. The leading wheelset (wheel 1 and wheel 8)[35] from the first powered bogie of car 1270, and leading wheelset (wheel 3 and wheel 6)[36] of the first unpowered bogie on that car were used for the analysis.
Sites 1 and 2 wheel-rail interfaces
Sites 1 and 2 were both on a section of mild, left-curving track and, because the sites were of similar geometry, the results of site 1 are presented (Figure 16).
On the high rail of the curve, a narrow band of contact was likely present for typical wheel positions,[37] localised on the gauge shoulder only. Narrow contact in this location was not ideal for promoting good adhesion conditions between wheel and rail. This was also away from the area of the rail targeted by sanding (the central crown) and toward a region of the wheel and rail that was more likely to be affected by any contaminant such as grease that could migrate from the wheel flange.
On the low rail of the curve, wheels were expected to have maintained a relatively broad, central contact that should have been able to utilise any sanding that occurred and should not have been susceptible to grease contamination.
As the low and high rail wheels are rigidly connected, the net available adhesion is the sum of the two. Therefore, while a reduction in available adhesion in braking could be expected on this curve, it is unlikely to have been significant.
Site 3 wheel-rail interface
On the straighter section at site 3, more centralised contact on both rails was predicted for both the leading axle of the car, and the leading axle of the first unpowered bogie (Figure 17).
Figure 16: Site 1 profile overlays showing likely contact scenarios for the leading axle
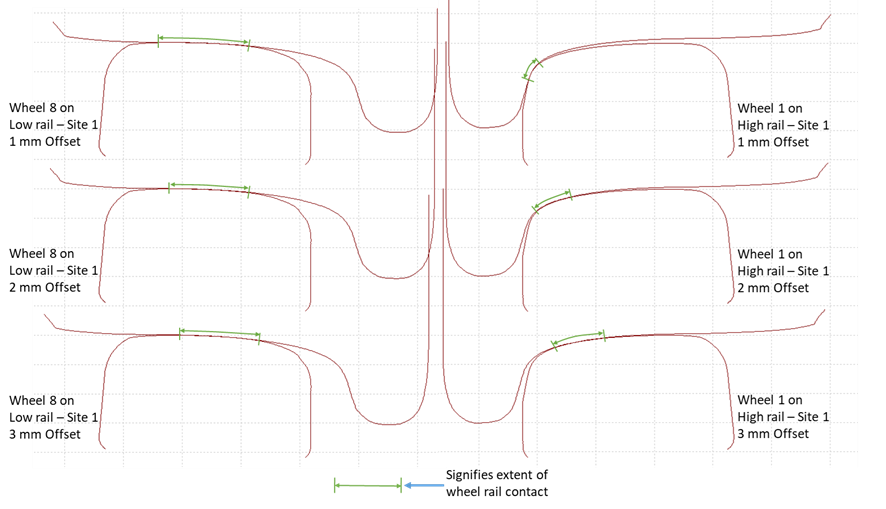
Figure 17: Site 3 profile overlays showing likely contact scenarios for two axles
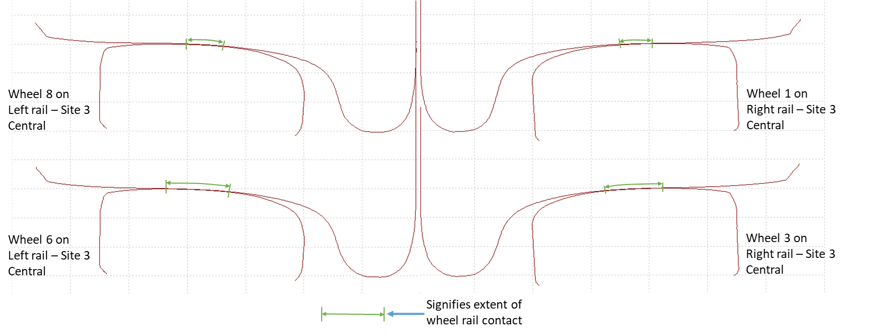
The figure shows the predicted wheel rail contact of the leading axle and third axle of car 1270 at site 3, assuming centralised running. Source: ATSB
Potential contribution of wheel-rail contact geometry to event
The braking response of the train at geometrically different locations consistently indicated low wheel-rail adhesion. This suggests that wheel-rail contact conditions, while not optimal, were probably not substantially contributory to the prevailing low adhesion condition experienced in this occurrence.
Train 8185 braking system
System description
The VLocity braking system automatically blended a combination of hydrodynamic[38] and friction brakes.[39] Brake Control Units (BCUs) were fitted to each car to control the braking and interfaced with the Vehicle Control Unit (VCU). The BCU determined the blend of hydrodynamic and friction braking to ensure the braking effort satisfied required brake demand.
The braking demand request was by the movement of the power/brake controller (PBC) (Figure 18). The PBC operated in power mode when pulled back from the centre ‘off’ position and in the brake mode when pushed forward from the centre position. There were six power notches that dictated the tractive effort. In brake mode, the controller moved seamlessly between minimum and full-service braking. When pushed fully forward, emergency braking was applied.[40]
Figure 18: Power/brake controller, WSP and sanding indicator
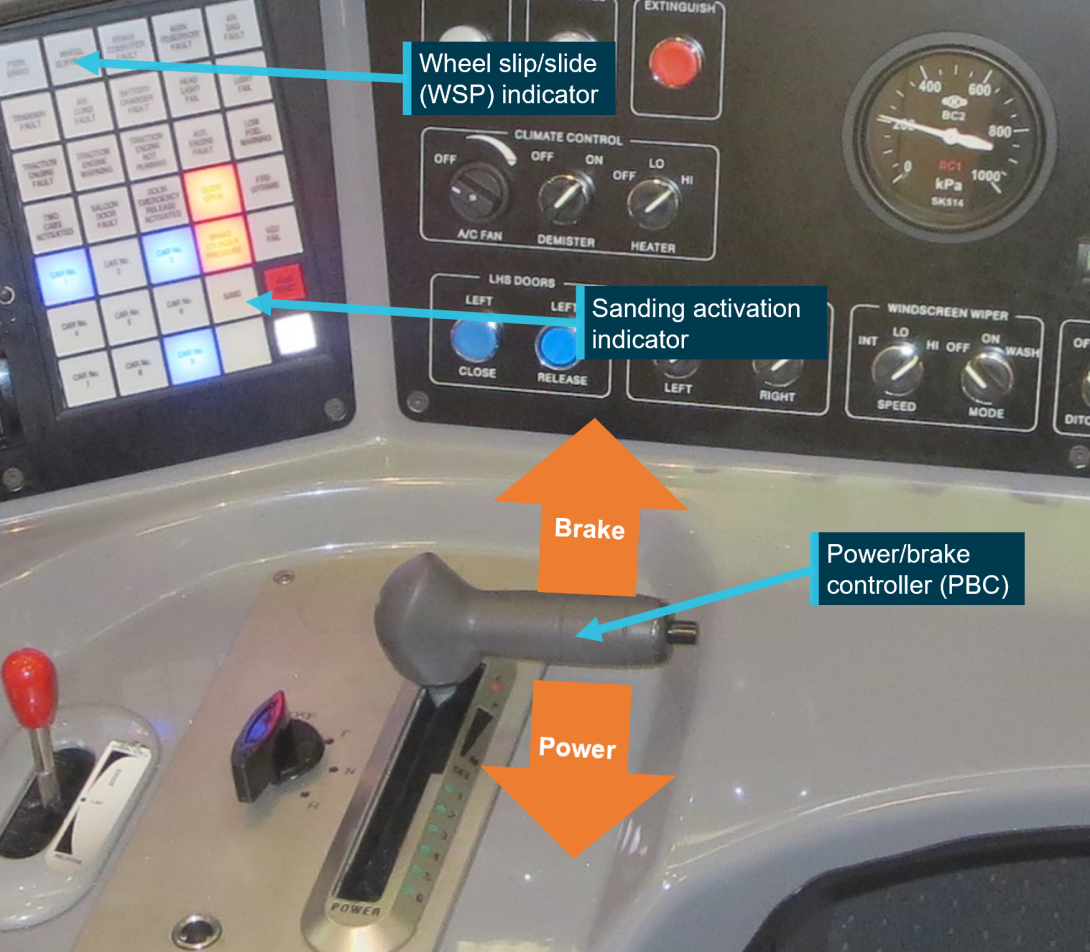
Source: CITS
Wheel slip/slide protection
Control systems to manage low adhesion
The term ‘adhesion’ is commonly used in the rail industry to describe the level of friction available to transfer forces between the wheel and the rail.
The VLocity was equipped with a wheel slip/slide protection (WSP) system to optimise traction and braking and prevent damage to wheels and track in instances of reduced adhesion conditions. The technical description of the VLocity braking system (Bombardier 2017) stated that:
When a sliding axle is detected and the pneumatic brake is active, the corresponding dump valve is energised by the BCU, so that the brake cylinders are vented which reduces the brake force until the wheels speed up again. An independent monitoring function is provided, which ensures that the friction brake is reapplied, if the dump valves are continuously energised for a certain time period.
When WSP was activated owing to wheel slide, hydrodynamic braking was automatically terminated, and all braking was supplied by the friction disc brakes. Once the wheel slide had been corrected, the system reinstated braking effort according to the train driver’s brake control setting. The system on the VLocity was designed to avoid wheels locking and did not allow for maintaining slide in certain circumstances.[41]
In the event of wheel slip being detected (such as when the train was attempting to depart from a station where the tracks were slippery, and powered axles were rotating faster than non-powered axles), engine speed and tractive effort were automatically reduced. Upon correction of the wheel slip condition, the system re-applied tractive power according to the train driver’s power control setting.
Activation of the WSP was evident to the train driver from a warning light on the control panel (Figure 18). The WSP warning light extinguished when adhesion was regained. Sanding was also automatically applied under such circumstances, and activation indicated by a separate warning light.
Physical removal of materials from wheel tread
The configuration of the train braking system can affect adhesion levels at the wheel-rail interface. Tread brakes or abrasive brake blocks that act to directly remove materials from the wheel tread can strongly influence the adhesion levels between wheel and rail. This was not a feature on the VLocity train that was equipped with disc brakes, and therefore did not have the benefit from having the wheels cleaned during brake application. RSSB (2014) found that tread brakes appeared to be less susceptible to moist rail head than trains with disc brakes.
Post-incident brake testing
Post-incident brake testing indicated that all three cars were compliant with the braking system routine test procedure (Bombardier 2014), and sufficient brake force was available to decelerate train 8185 had there been sufficient adhesion at the wheel-rail interface.
Testing also showed the BCU on all three cars met requirements in relation to WSP activation and the operation of dump valves to reduce brake cylinder pressure on detection of wheel slide.[42]
Sanding System
Layout
VLocity DMUs were fitted with a sanding system to apply sand to the rail head to improve the friction between the wheels and rails. Sand could be applied automatically by the WSP system or manually by the driver using a foot pedal. Sanders were located on the front and rear cars of the three-car set. The TM cars were not equipped for sanding.
The sander operation depended on whether the train was powering, or under braking (Figure 19). If the train was under power and wheel slip was detected, sand was applied behind the second axle of the first car and in front of the third axle of the rear car of the train. If the train was braking, sand was applied (only) behind the second axle at the front of the train.
Figure 19: VLocity DMU sanding arrangement pertinent to the direction of travel.
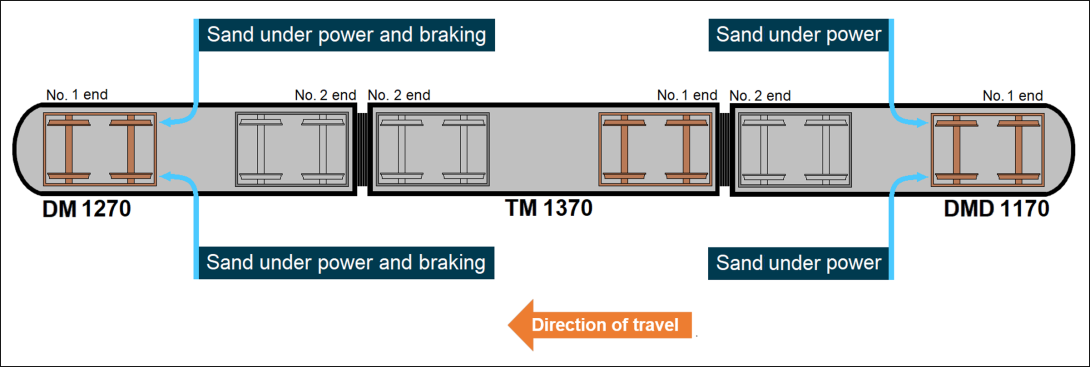
Source: CITS
This arrangement for sand application was the same as for the VLocity two-car set (with DM and DMD cars only) introduced into passenger service in 2005.
Position of sanding nozzle relative to wheel
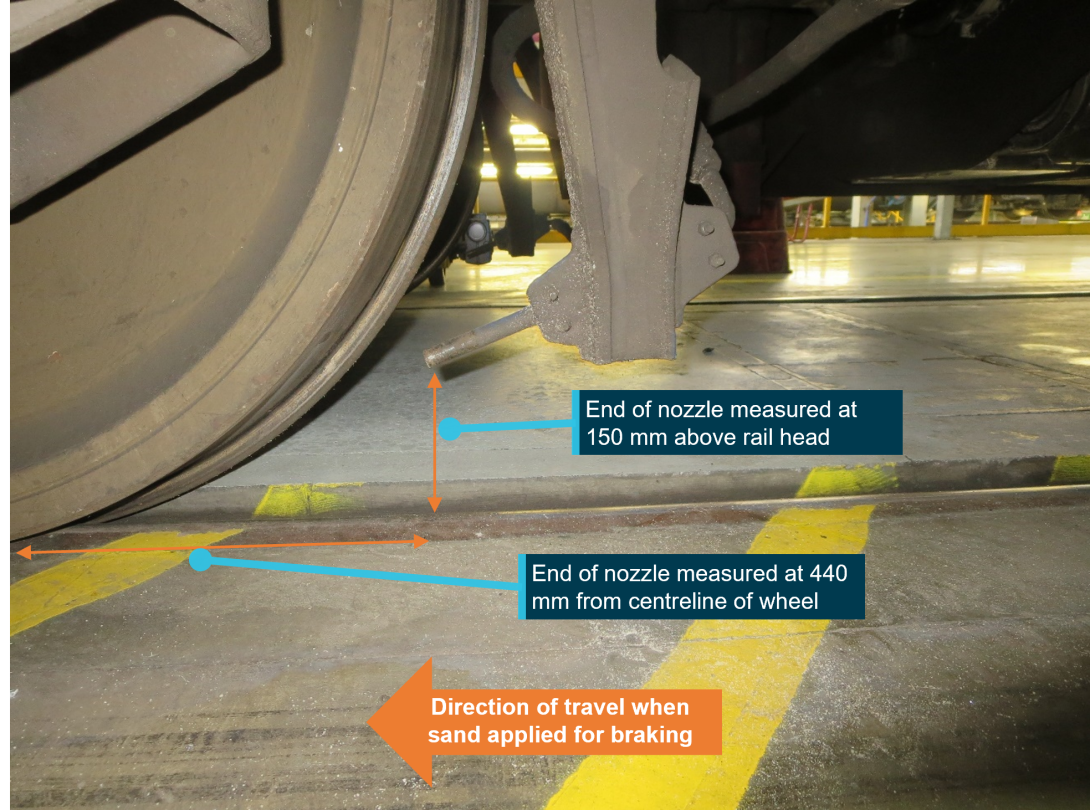
The nozzles of the sanders that operated in braking were positioned behind the second wheelset, facing toward the direction of train travel (Figure 20).
Measurement of discharge nozzles on car 1270 found that the end of the sand discharge pipes were about 150 mm above the rail head and about 440 mm from the wheel centreline. Bombardier drawing titled ‘Body to bogie motor bogie attachment’ (BTA 2006) specified the nozzle to be 120 mm above the rail head and 412 mm from the centreline of the wheel. The nozzles were therefore located about 30 mm higher than the specified height in the drawing.
The angle of the nozzles was approximately 20 degrees to the rail surface and was in the plane of the rail. The nozzles were midway between the inner and outer surfaces of the wheel.
Figure 20: Location of sand nozzle relative to the wheel
Source: CITS
Sand boxes and metering units
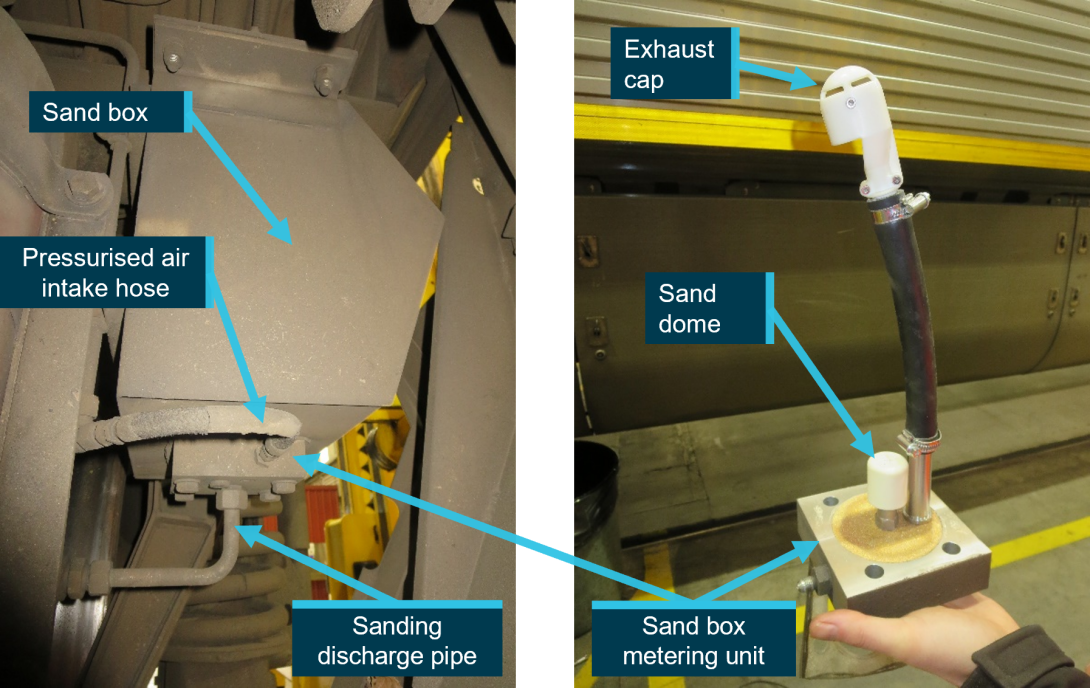
Two sand boxes were fitted at the cab-end bogies of each of the DM and DM(D) cars and incorporated sand metering units (Figure 21).
Figure 21: A car 1270 sand box and sand metering unit removed (right-hand side image).
Source: CITS
When sanding was required, solenoid valves were energised which supplied pressurised air from the main reservoir into the sanding system through a sintered metal plate. Within the sand box, supply air was used to agitate the sand and meter the desired sand flow rate through the sanding discharge pipe and discharge nozzle (Appendix A).
Sand specification
V/Line used sand sourced from a local supplier, either bagged or in bulk, depending on the depot being supplied. The product was silica sand, sourced from local sand quarries and screened to a specified grain size. The sand grain size profile was finer than specified by RISSB guidelines for braking applications (Appendix B).
Routine maintenance of sanding system
V/Line Work Instruction VEWI-79 (V/Line 2019) detailed the VLocity servicing schedule. This required:
- sand boxes to be checked and filled every 21 days.
- checking the sand box assemblies and that the sanding units operated every 31,000 km.
- checking the sand box lid every 93,000 km.
- checking the sanding magnet valve every 186,000 km.
- checking the sanding brackets and hoses every 186,000 km.
- checking the sanding system pressure reducing valve and isolating cock every 372,000 km.
The maintenance processes did not require sand flow rates to be monitored over time, against defined criteria.
V/Line did not have a process in place for nozzle position or alignment relative to the wheel to be checked or adjusted during maintenance. The group standard in Great Britain for sanding equipment (RSSB 2021) stated that maintaining sand discharge nozzle alignment was necessary to maintain performance of the sanding equipment.
Post-incident inspection and testing of sanding system
Condition of sand boxes following the occurrence
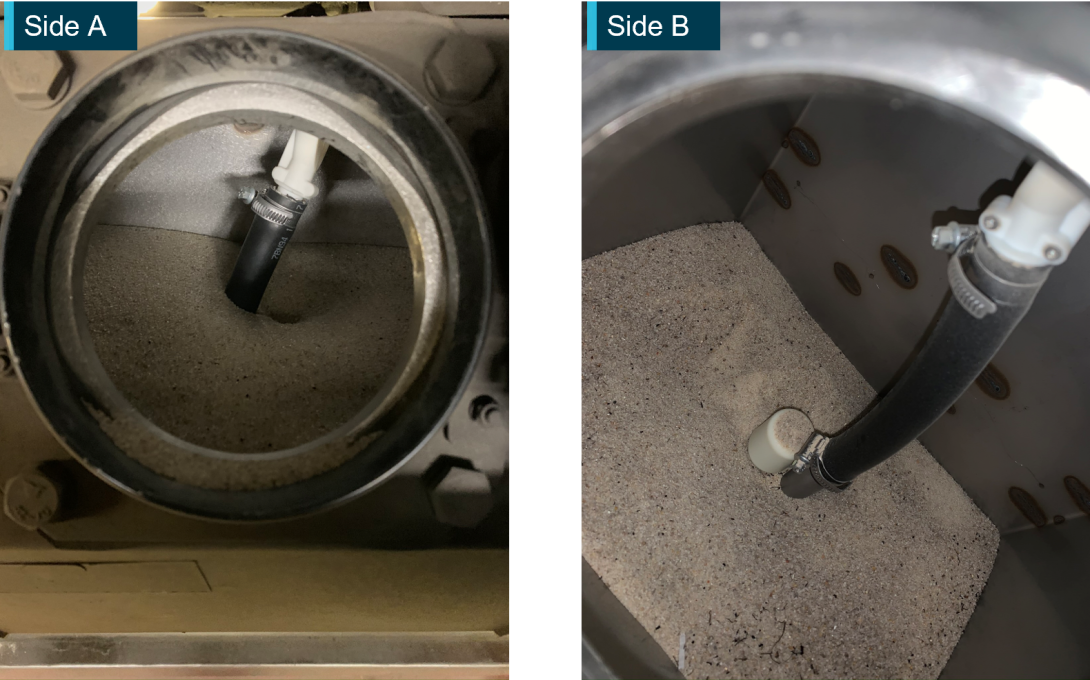
The condition of the sand boxes in car 1270 were checked following the stabling of train 8185 after the incident (Figure 22).
Source: CITS
The sand box on side A (left side in direction of travel) contained approximately 21.6 kg of sand compared to the nominal capacity of 25 kg. The sand box on side B contained approximately 3.9 kg when measured and was effectively depleted.[43]
Flow rate measurements prior to disassembly and cleaning
Following the incident, 3VL70 was tested by Bombardier at Ballarat East depot to assess the function of the train’s sanders. These tests were witnessed by V/Line and the Chief Investigator Transport Safety (CITS). The expected and desired sand delivery rate was advised to be between 1.5 and 2 kg/min.
Sand output was measured from side A and B sanders on cars 1270 and 1170 (Table 2). The first set of tests (1-3) were conducted without any addition of sand to the sand box from the time of the incident. The remaining tests (4-6) were additional tests conducted on car 1270 boxes only, with the sand boxes emptied and then half-filled with sand that was supplied to Ballarat East depot.[44] The desired rate of 1.5-2 kg/min was only achieved in one test; test 5 on sand box B of car 1270 after it was refilled.
Table 2: Sander performance tests
| Car 1270 sand flow (kg/min) | Car 1170 sand flow (kg/min) [1] | |||
| Side A | Side B | Side A | Side B | |
| Test 1 | 0.829 | 0.104 | 0.05 | 0.711 |
| Test 2 | 0.654 | 0.014 | 0.434 | 0.622 |
| Test 3 | 0.595 | 0.008 | 0.089 | 0.756 |
| Test 4 | 0.371 | 0.987 | [2] | [2] |
| Test 5 | 0.553 | 1.627 | [2] | [2] |
| Test 6 | 0.452 | 1.472 | [2] | [2] |
| Average | 0.6 (tests 1-6) | 1.4 (tests 4-6) | 0.2 (tests 1-3) | 0.7 (tests 1-3) |
[1] The sanders on the rear car (1170) were not designed to dispense sand during braking into Ballarat.
[2] No data recorded
Source: Bombardier with averages by CITS
Sander inspections
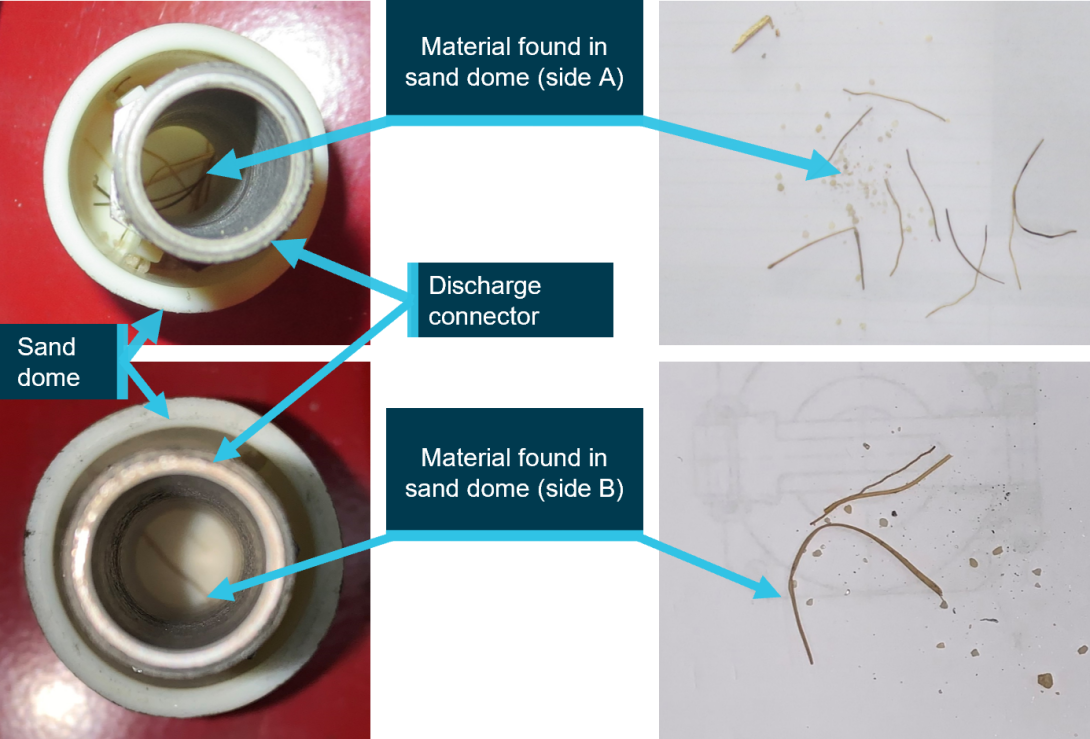
Following the initial flow tests, the sand was drained from all the sand boxes and the sanding units disassembled for inspection. Dry vegetation was found in the sand domes of all metering units.
For the units from car 1270, there was significant vegetation in both units, and more in the unit from side A (Figure 23).
Figure 23: Vegetation in metering unit sand domes of car 1270
Source: CITS
Vegetation was also found in the sand domes of the metering units of car 1170 (Figure 24).
Figure 24: Vegetation in metering unit sand domes of car 1170.
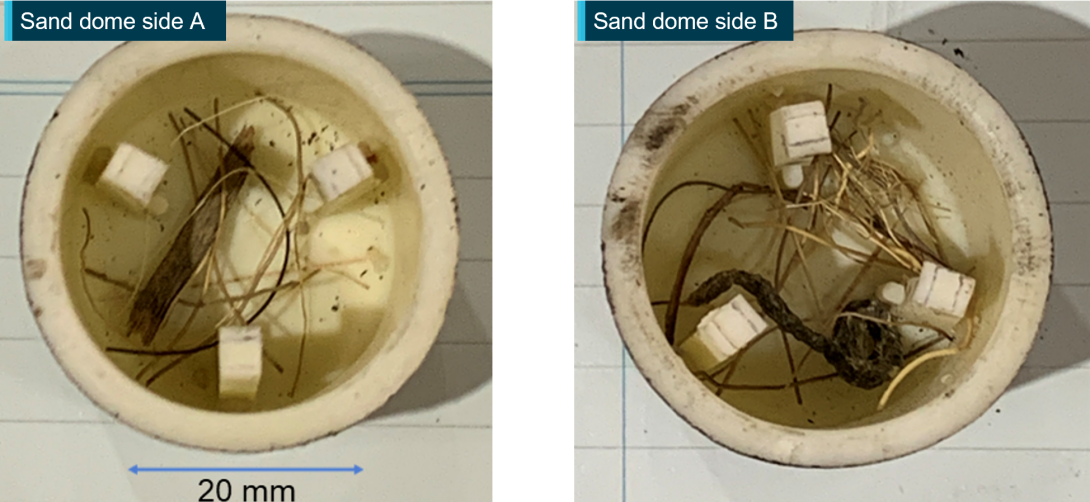
Note the sand discharge connector pipe is not shown in this figure. Source: CITS and Bombardier.
Sander flow rate measurements following cleaning
Vegetation was removed and the sanding units were reassembled. Flow tests were repeated and sand delivery rates consistently matched the expected flow rate (Table 3).
Table 3: Sander performance tests following cleaning of units
| Car 1270 sand flow (kg/min) | Car 1170 sand flow (kg/min) | |||
| Side A | Side B | Side A | Side B | |
| Test 1 | 1.855 | 2.050 | 1.985 | 1.875 |
| Test 2 | 1.835 | 1.865 | 1.965 | 1.855 |
| Test 3 | 1.805 | 1.915 | [1] | [1] |
| Average | 1.8 | 1.9 | 2.0 | 1.9 |
[1] No data recorded. Source: Bombardier
Sander rate comparison of VLocity trains that had experienced overruns
In July 2020, V/Line undertook retrospective testing of sanders on VLocity trains, including nine involved in low adhesion overrun incidents between 2010 and 2020. The four sanders on each of the nine trains were tested, giving a total of 36 tests. Testing found that 15 of the 36 sanders tested did not meet the desired sand delivery output of 1.5-2 kg/min (Appendix C).
There was a wide distribution of flow rates between 0 and 2 kg/min (Figure 25).
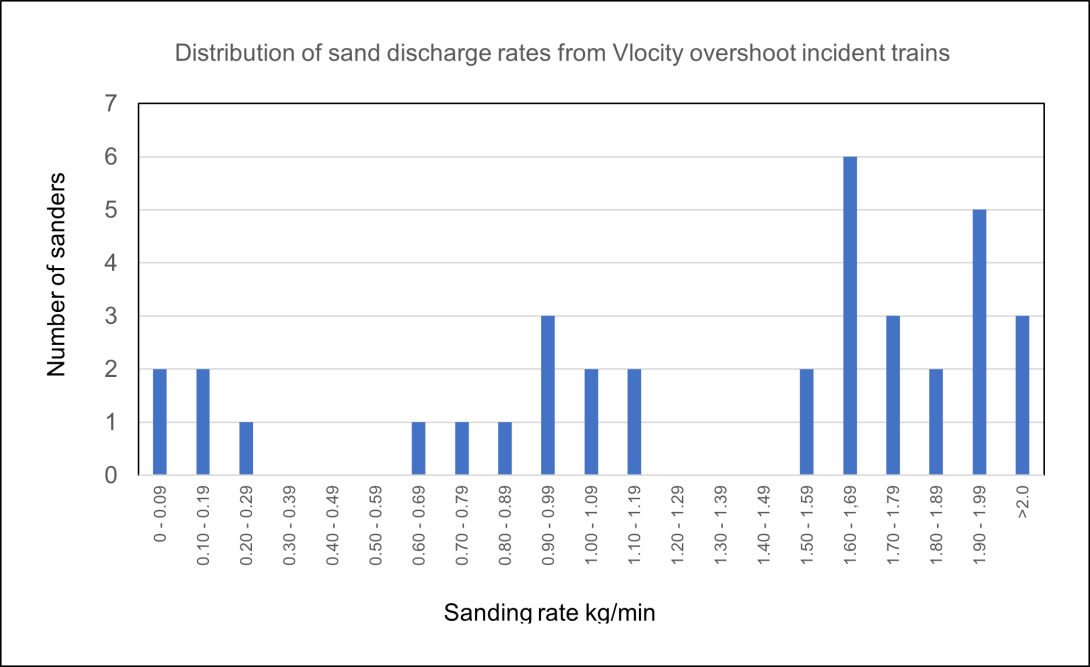
The bar chart shows the distribution of flow rates across the 36 sanders tested. The sanders were those fitted to nine trains involved in overruns between April 2010 and June 2020. The tests were conducted July 2020. Source: CITS, based on Bombardier test data
Type testing of VLocity braking in low adhesion conditions
Type testing
Prior to delivery, type testing of the train’s equipment was undertaken to verify that the equipment met the specification (Bombardier n.d.). Pre-acceptance slip/slide type tests were performed on the VLocity three car set in 2008. A test procedure (Bombardier 2008) was developed with the objective of verifying correct operation of the slip/slide equipment. There was no type testing to specifically verify sander performance against defined criteria.
Testing was conducted on a closed section of track with the train at both tare[45] and gross loaded mass. For low adhesion tests, the train was equipped with a watering system that supplied a water/detergent mix to the leading wheelset of the train.[46]
Type testing outcomes
The test report (BTA 2008b) concluded: ‘… the slip/slide equipment responded correctly both to skid and spin situations and provided an effective protection of the wheels from wheel flats’.
Low adhesion tests (in braking) were conducted with the train set to brake in blended (fiction and hydrodynamic), friction only and emergency conditions and braking (stopping) distance recorded (Figure 26 and Figure 27). The tests were conducted for a range of initial speeds, and for each speed, there were 3 tests without sand (relying on the WSP system only), and one test with sanding activated. No statistically significant difference in the braking distance with or without sanding applied was observed.
Figure 26: Slip/slide braking test results for a tare loaded three-car set, for normal braking, friction only braking (F) and emergency braking (E), and range of initial speeds.
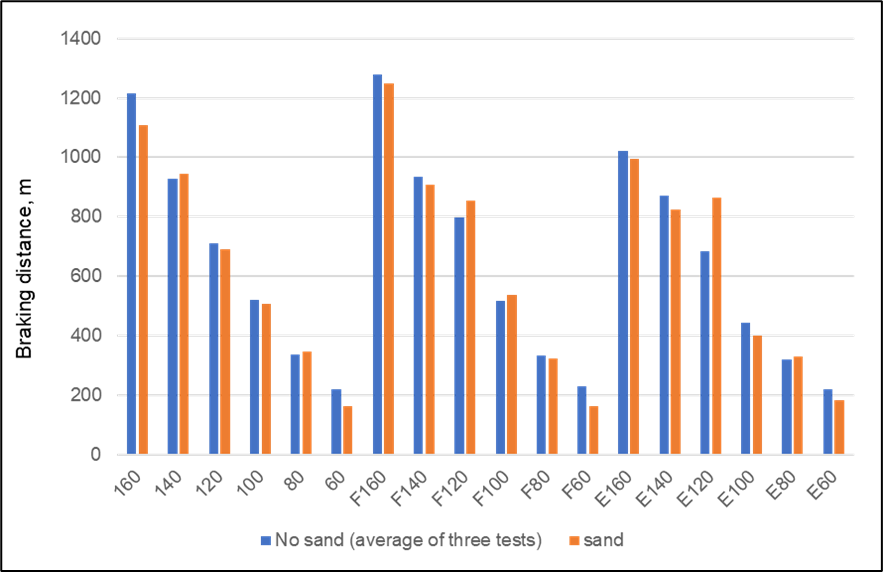
Source: Bombardier, CITS
Figure 27: Slip/slide braking test results for a gross loaded three-car set, for normal braking, friction only braking (F) and emergency braking (E), and range of initial speeds.
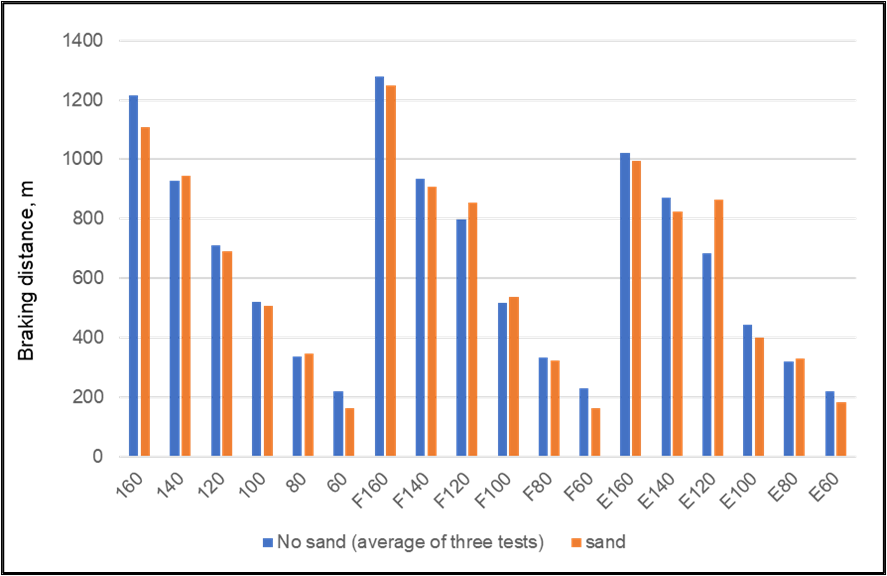
Source: Bombardier, CITS
As would be expected, braking (stopping) distances during the low adhesion type tests exceeded stopping distances for braking on dry track (Figure 28). The longest recorded stopping distance from 160 km/h for the loaded, friction only braking test scenario was about 1400 m. This equates to a retardation rate of 0.71 m/s2 or about 75 per cent of the dry retardation rate.
Figure 28: VLocity slip/slide type test results from 2008, friction braking scenario
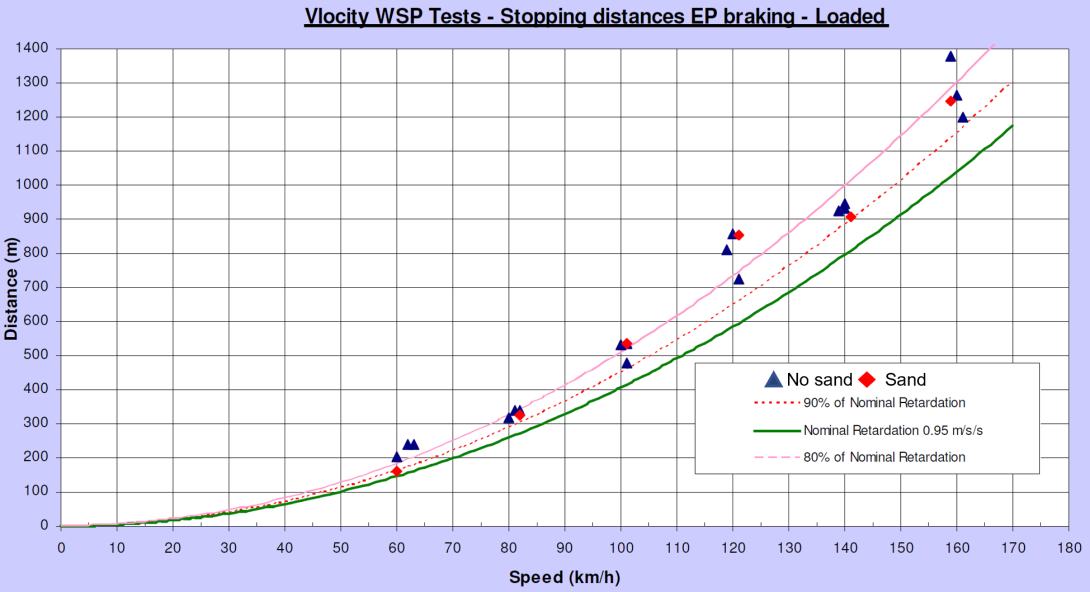
This graph shows the outcome of individual tests for the gross (loaded) and friction (only) brakes scenario. For each starting speed, there were 3 tests without sand (relying on the WSP system only), and one test with sanding activated. Source: Bombardier test data
Driver training and actions taken by the driver of train 8185
Instructions for drivers regarding low wheel-rail adhesion
The V/Line Professional Driving Booklet contained information describing low adhesion conditions at locations where high levels of trackside vegetation existed (with cuttings presenting a particular problem), and during light drizzle and immediately following stormy conditions (V/Line n.d.). The booklet also warned against errors leading to low adhesion incidents. These included not considering environmental indicators of possible low levels of rail adhesion, and incorrect braking techniques (these being unspecified) for low adhesion conditions.
Further guidance in the form of an information notice (V/Line 2013) was distributed to drivers in 2013 (Appendix D). The notice included advice on driving techniques in low adhesion conditions, automatic and manual sanding, the WSP system, and extended stopping distances. The guidance indicated that the shortest stopping distance (on a VLocity) would be achieved by allowing the WSP system to control braking effort.
V/Line used simulator training for its drivers. However, drivers did not receive ongoing driving simulator instruction in handling low adhesion conditions as part of continuation training.
Actions taken by the driver of train 8185
The driver reported experiencing some wheel slip on departing Ballan and applying manual sanding. The driver reported and train data confirmed that the train subsequently experienced intermittent wheel slip (in power) and wheel slide (during braking) from Ballan onwards.
The driver reported having applied braking earlier than would be usual on the approach to Ballarat due to the conditions of wheel slip experienced earlier in the trip. Shortly after the initial application, they released the brake on encountering wheel slide, reapplied and then released. During this phase in the approach, the driver’s intention was to attempt to manage the braking in the low adhesion conditions through release and reapplication of braking demand.
The driver subsequently made a full-service brake application when about 2.6 km from the intended stopping point, and the management of braking effort was then with the train’s WSP system. For the train to stop in this distance, a retardation of about 0.4 m/s2 was required. In dry conditions, a retardation rate of 0.95 m/s2 would be expected.
The driver moved the controller from a full-service braking application to emergency when the train was about 300 m from the intended stop. The driver reported that they chose not to make an emergency brake application earlier, concerned that there would be a time delay to regain braking control if they were to move back to service braking.
Risk register references to loss of adhesion
V/Line risk register
Loss of adhesion (specifically listed as wheel to rail interface failure) was recorded in V/Line’s Train to Vehicle risk register as a risk source for the risk event of a road user being presented with inadequate warning time at a level crossing. Despite V/Line having commenced work on improving sander design at the time of the collision, no other risk register references to loss of adhesion were provided. The risk controls for the risk event relating to loss of adhesion were listed as the construction and maintenance of level crossings.
Work undertaken by V/Line on improving sander design
Despite there being no V/Line risk register entry for loss of adhesion resulting in a collision, V/Line had commenced a review of the sanding system in 2016, and in 2019 commenced a program to modify all VLocity trains to include an additional sanding arrangement on the intermediate cars. These sanding systems were activated in 2022.
RISSB hazard register
RISSB had developed a hazard register (RISSB n.d.), primarily to support the development of RISSB standards. This register had been refined in a programme of work drawing on industry expertise and it was a resource made available to its members. Within this register, inadequate adhesion was listed as a factor in the collision and derailment precursor,[47] for which the source of the hazard was ‘brakes being inadequate when moving’.
Other similar occurrences involving V/Line VLocity
Ten VLocity overrun events that occurred between April 2010 and June 2020 were identified for closer review. These events were either greater than 100 m in length, or events that were on the same day (Table 4).
Table 4: Significant VLocity overrun events selected for further analysis
| Approximate overrun length | 1000 m | 500 m | 100 m | Not stated, but more than one event on same day |
| Number of events | 2 | 2 | 2 | 4 |
Source: V/Line
Of the two events that recorded overruns of 1000 m or greater, both occurred at Macedon. The first of these events occurred in August 2010, with the driver reporting wet and slippery conditions. The second occurred in February 2018, with the driver reporting no wheel-rail adhesion. Of the overruns that were reported to be approximately 500 m, one occurred at Rochester in 2014, and the other at Drouin in 2016. Slippery rail conditions were reported for both these incidents.
While inspections were made of the track in some of these instances, there was no record of examination of the train sanding system or assessment of sander performance and its potential contribution to an overrun event.
Safety analysis
Wheel-rail adhesion
Estimated level of wheel-rail adhesion
The wheel slip/slide protection (WSP) system was active during braking on the approach to Ballarat Railway Station indicating that the level of adhesion between wheel and rail was insufficient to support the level of braking demanded. The response of the train’s braking system during the event provided an estimate of the wheel-rail adhesion for train 8185.
Commencing about 2.6 km before the intended stopping point at the station, there was a near continuous full-service brake application for 66 s.[48] During this period of braking, a train retardation of about 0.2 m/s2was achieved compared to a full-service braking rate in dry conditions of 0.95 m/s2. Available adhesion experienced by train 8185 was therefore likely to have been between 0.02 and 0.03 on this section (Appendix E).[49] This reflects very low to extremely low levels of available adhesion.
Sources of low adhesion conditions at Ballarat
The level of adhesion achieved between wheel and rail can be strongly influenced by rail surface contamination. There are a range of contaminants that may occur including leaf matter, oils and greases, dry contaminants such as iron oxides and dust, and small amounts of moisture.[50]
Post-incident site measurements[51] found an average friction coefficient on wet rail of 0.29 (at walking pace), that may reduce by around 39 per cent for a train travelling at 160 km/h (IRT 2020). Based on this reduction figure, the measurements would equate to a level of adhesion of about 0.18 for a train speed of 160 km/h. These levels are not unusually low for wet rail and did not indicate the presence of a lubricating agent. Post-incident track inspections also did not identify significant leaf, oil or grease contamination on the approach to Ballarat Railway Station.
In the absence of any apparent matter contamination, the most significant environmental condition present at the time of the occurrence was a small amount of moisture. Work commissioned by RSSB (2014) reviewed research and data gathered from service experience and found that there was evidence for low adhesion being caused by slightly wet rails. The report defined the wet rail phenomenon as:
Poor adhesion conditions caused when low levels of moisture are present at the wheel-rail interface. These conditions are associated with dew on the rail head, very light rain, misty conditions and the transition between dry and wet rails at the onset of rain. They are not necessarily associated with the additional presence of other (non-water) rail head contaminants. These conditions are not associated with continuous rain.
Weather recordings indicated that between 2300 and 2330 on the night of the event, light rain started to fall in the Ballarat area. Rain was also observed on CCTV footage of Ballarat Railway Station and Humffray Street crossing at the time train 8185 passed. It is probable that this small amount of rail head moisture was the primary environmental factor in the development of low adhesion conditions at the wheel-rail interface of train 8185. The train that arrived into Ballarat prior to train 8185 and prior to the light rain did not experience wheel slip or slide events.
Noting the mostly dry conditions and prevailing winds in the lead up to light rain that evening, the possibility that particulates had mixed with moisture to form an unusual interfacial layer was considered. An investigation of recurring low adhesion events in Melbourne (OCI n.d.) found that (in those instances):
The majority of overrun events have occurred with rail head moisture resulting from light rain or dew. The investigation concluded that moisture combined in particular proportion with rail head contaminants such as iron oxides and mineral clay produces a liquid suspension sufficient to result in low coefficient of friction conditions including instances of low shear strength within the interfacial layer.
However, there was insufficient evidence in this instance to conclude if any other contaminant had influenced the available adhesion at the wheel-rail interface.
Sanding system design and performance
Performance of train 8185 sanding in this event
For many trains, sanders are used to modify conditions between wheel and rail in slippery conditions. The entrainment of sand into the wheel–rail contact has been shown to be an effective way of improving friction levels between the wheel and rail in conditions of low adhesion (RAIB 2005). Train 8185 was fitted with sanders for that purpose.
The event recorder for train 8185 showed that sanding was automatically requested on the detection of low wheel-rail adhesion by the train, and was active for a long period on the approach to Ballarat Railway Station. However, available adhesion between wheels and rails remained very low indicating that the sanders were ineffective at raising the friction between wheel and rail surfaces.
Positioning of sanding nozzles
Location of sanders relative to wheels
The VLocity three-car set was fitted with sanding devices on its lead and trailing cars. During braking, by design only the sanders on the leading car operated to dispense sand (Figure 29). The nozzles on these sanders were located behind the leading bogie of the lead vehicle, with the outlet facing toward the rear wheels of the leading bogie.
Figure 29: Train 8185 sanders activation during braking
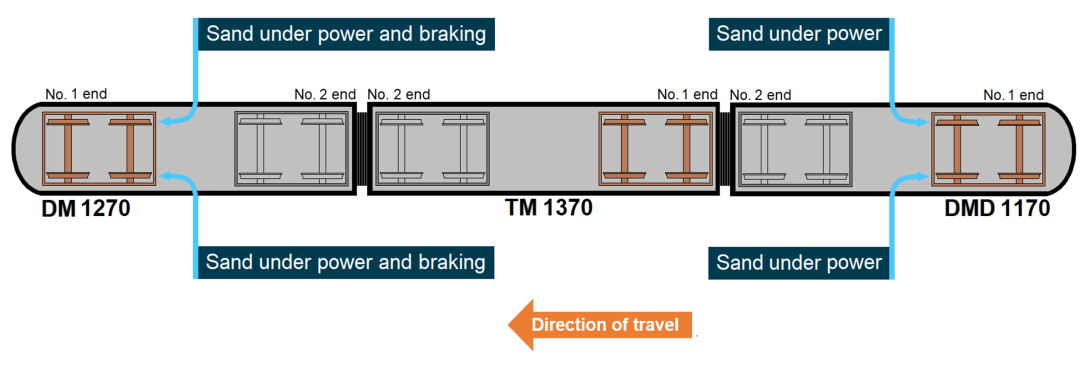
Source: CITS
The RISSB standard for Braking Systems on Multiple Unit Passenger Rolling Stock (RISSB 2014), introduced in 2014, stated that sanding systems should, in general, conform to the requirements of GM/RT2461. Standard GM/RT2461 was developed as a Railway Group Standard in Great Britain (Railway Safety 2001) and mandated that new multiple unit trains in Great Britain be fitted with a sanding system. The standard also specified requirements for any systems that were installed on existing trains.
The version of GM/RT2461 that existed at the time of VLocity design specified that in braking mode:
...sand shall be delivered to the railhead by the leading vehicle only for all train formations (including multiple formations), at a location forward of the third axle and after the second axle, in the direction of travel.
The 2016 update of GM/RT2461 was more specific in relation to the position of sand delivery forward of the third wheelset in the direction of travel. The later version of the standard specified the necessary criteria for sand application under braking and contained a good practice design guide for sanding equipment. This guide stated that sanding equipment would be more effective in reducing the risk from low adhesion if the discharged sand was effectively focused ‘just in front of the wheel-rail contact point’ and delivered at a rate within the design and maintenance parameters of the equipment. The practice of sand being delivered in front of the wheel-rail contact point for braking, rather than behind it, was a consistent design feature sighted on rolling stock studied by this investigation.
On a VLocity three-car set, the location of the sanding nozzles (for braking) behind the wheels of the lead bogie was inconsistent with these design practices and likely to be a significant recurring factor in the diminished performance of the sanding system in improving adhesion.
Response from Alstom in relation to location of the sanding nozzles
Alstom provided background on the design development leading to the locating of the sanding nozzles behind the wheels of the lead bogie, and advised that the initial design was considered consistent with the GM/RT2461 standard that existed at that time. Alstom also advised that stakeholders[52] involved at the time of the procurement of the initial two-car VLocity prioritised train detection (track circuits) over maximising the effectiveness of the sanding system. Alstom advised that effective application of wheel slip/slide protection system was considered the primary method of optimising the brake application to prevent the formation of wheel flats, and to improve braking performance in low adhesion conditions.
An unwanted side effect of low adhesion remedial treatments such as sand was a failure of the train to activate a track circuit, with subsequent safety implications related to signalling and level crossing operation. Alstom advised that DMUs were considered to have a higher train detection risk over an Electric Multiple Unit (EMU) as there was no return current in the rail to ‘burn off’ railhead contamination. Any build-up of sand deposit on the rail was considered to increase the risk (of lack of train detection).
Height and distance of nozzle from wheel-rail contact point
Experiments have been conducted into the effect of the height and longitudinal position of the sanding nozzle on the proportion of sand reaching the rail (Lewis et al. 2018). In the test conditions used, it was found that the further the nozzle was from the contact point, generally the lower the proportion of dispensed sand being deposited on the rail (Appendix F).
The results of these experiments cannot be directly related to train 8185 given the difference between the test arrangements and the configuration of train 8185. However, for comparative purposes, the height and longitudinal offset of the sanding nozzles on car 1270 were plotted against the test samples. It was found that the nozzles on car 1270 were higher and more longitudinally distant from the wheel-rail contact point than the tested samples.
Sand availability
The amount of sand remaining in each sand box on car 1270 after the incident differed significantly. Post-incident inspection found 21.6 kg remaining in the sand box on side A (left side in direction of travel). Based on the average measured (post-incident) flow rate from this unit (0.6 kg/min) and the time activated during the journey, the sand box on side A was probably near full at the time train 8185 departed from Southern Cross Station.[53]
In contrast, only about 3.9 kg of sand remained in the sand box on side B (right side) of car 1270.[54] When tested with the remaining sand, only a small amount of sand was dispensed and the sand box was therefore functionally empty. It was not possible to ascertain at which point the sand box on side B was effectively exhausted. It is possible this occurred on the final approach or earlier in the journey. Assuming the sand was exhausted as the train came to a stop in Ballarat, the box would have been no more than half full at the start of the journey from Southern Cross Station.[55]
A process for preparing the train at Geelong on the morning of the incident included a checking of the sand levels in the sand boxes. However, this process did not include any quantitative criterion on the volume of sand required to be in the box at that inspection, nor was there a separate check-off for this item of the inspection. The sand boxes did not contain a mark or trigger point for the topping up of sand.
Sanding flow rates
Post-incident disassembly of sanders on train 8185 found that all units were contaminated with vegetation. Comparative testing conducted before and after cleaning of units found significant improvement in flow rates after cleaning (Table 5). All cleaned units met the desired flow rate of 1.5-2 kg/min.[56]
Table 5: Mean sand flow rates from train 8185 sanders, before and after cleaning
| Car | Side | Before cleaning | After cleaning |
| 1270 | A | 0.6 kg/min | 1.8 kg/min |
| 1270 | B | 1.4 kg/min | 1.9 kg/min |
| 1170 | A | 0.2 kg/min | 2.0 kg/min |
| 1170 | B | 0.7 kg/min | 1.9 kg/min |
Source: CITS analysis and summary of V/Line test data
Based on the test results, it is probable that in service, including on the day of the incident, the amount of sand dispensed from the car 1270 sanders (during braking) was less than the desired rate of 1.5-2 kg/min. Research has found that small changes in flow rate can lead to reductions in the amount of sand delivered to the wheel-rail contact (Lewis et al. 2018).
Testing of sanding systems by Rail Safety Standards Board (RSSB)
In 2009, the RSSB published research that evaluated the performance of sanders on multiple units in Great Britain (RSSB 2009). The research found that there was considerable variability in the performance of sanding systems with many operating well below the 2 kg/min discharge rate recommended (Appendix G).[57] The RSSB research material was compared with V/Line testing conducted of VLocity vehicles involved in overrun incidents. Similar variation in discharge rates across the fleet were observed in the RSSB and VLocity tests (Appendix G).
The RSSB report identified the lack of regular maintenance and ineffective design as causes for sanding systems not dispensing the required amount of sand, and that performance may deteriorate over time. The research also recommended that acceptable discharge rates in the maintenance manuals should be close to the design criteria for the system.
Maintenance of the VLocity units did not include testing of sander discharge flow rates. Without measurement of flow rates or some other assurance process, deficiencies could not be identified and addressed.
Influence of crosswinds
Around the time of the occurrence, recorded winds were 33 km/h gusting to 42 km/h from the north, and so orientated across the direction of travel of train 8185 on its approach into Ballarat. Experiments conducted on sanding equipment have shown that even moderate crosswinds can adversely influence the amount of sand reaching the rail (Lewis et al. 2018). It is possible that the crosswinds at the time of the event influenced the distribution of sand towards the rails, particularly when present in combination with the location of sander nozzles (for braking) behind the wheel-rail contact point, and the height of the sanding nozzles above rails.
Missed opportunities to identify sanding system weakness
Type testing of VLocity three-car set
Braking system type testing of the VLocity three-car set was conducted in 2008 against a performance requirement for braking on dry rail. Additional type testing was conducted with a water-detergent mix to simulate low adhesion conditions, with the aim to demonstrate WSP operation. Data from this whole-of-train WSP testing in reduced adhesion conditions showed stopping distances with and without sand being applied. However, the results of these tests did not demonstrate any consistent reduction in stopping distances when the sanders were activated.
While not mandatory in Australia and noting its release was after the 2008 type testing, the European standard for wheel slide protection (CEN 2018) stated that testing should include assessment of the impact of the sanding on the low adhesion braking performance achieved. The type testing of the VLocity three-car set in 2008 did not include demonstration of performance of the sanding system against specified criteria. This was a missed opportunity for weaknesses in the sander design configuration (for braking) to be identified and remedial action taken.
Other investigations have identified gaps in processes for defining and proving rolling stock performance in low adhesion conditions. An investigation of recurring low adhesion events in Melbourne (OCI n.d.) found that (in that instance):
…performance requirements for braking in low-adhesion conditions were not adequately defined within the procurement documentation for the train.
and,
… acceptance testing did not fully verify the braking performance … for some conditions that were later to be experienced in service.
V/Line response to previous low adhesion events
Significant events associated with low adhesion conditions and involving VLocity rolling stock were experienced on previous occasions on the V/line network. While inspections of the track were made that resulted in treatments such as vegetation removal and scrubbing of the track, there was no record of examination of the train sanding system or assessment of sander performance and its potential contribution to the overrun events.
Risk of collision owing to low adhesion
Despite previous low adhesion events, the loss of adhesion leading to increased stopping distance was not recognised as a risk source for a train overrun collision in V/Line’s risk registers. The risk of a collision, either with a level crossing gate, terminal infrastructure, or another train, was not documented. The only risk event reference to loss of adhesion was for a road user being presented with inadequate warning time at a level crossing. Controls to treat the risk of collision associated with low adhesion were also not documented in V/Line’s risk registers.
The risk of collision events associated with low adhesion had been identified by other standards and investigative agencies. RISSB, the industry body, had identified inadequate adhesion as a factor for collision and derailment owing to brakes being inadequate when moving, and documented this in their hazard register (RISSB n.d.). Also, in 2013 ATSB published its investigation report into a collision of a passenger train into a station buffer stop at Cleveland, Queensland (ATSB 2013). In relation to the management of risk, one of the findings made in that report was that:
Despite numerous occurrences of slip/slide events in the years leading up to the accident at Cleveland, Queensland Rail’s risk management processes did not precipitate a broad, cross-divisional, consideration of solutions to the issue including an investigation of the factors relating to poor wheel-rail adhesion.
The ATSB advised that this finding affected all owners and operators of rolling stock fitted with electro-pneumatic disc actuated braking systems incorporating wheel slip/slide protection control.
Lydiard Street gates
Proximity of gates to departure signal
The Lydiard Street North crossing gates were closed to rail traffic (and open to road traffic) except when required to be opened for the passage of trains. For train 8185, the level crossing and gates were protected by departure signal 20 being at stop. Signal 20 would remain at stop until the gates were closed to road traffic and made open for the passage of train 8185. That operation, to open the gates to rail, had not yet commenced when train 8185 arrived.
Figure 30: Departure signal 20 and the Lydiard Street North level crossing

This photograph was taken after the event. The gates on the northern side of the crossing are shown closed to road traffic. The departure signal 20 is shown at stop, as it was when passed by train 8185. Source: CITS
Standards existing prior to the event, and another published following the event, identified the risks associated with short distances between protective signals and level crossings, and potential mitigating actions (Appendix H). Possible mitigating actions cited include increasing the safety zone between signals and level crossings, particularly for new crossings, and train protection systems or other predictive systems to detect train overspeed in sufficient time to take remedial action.
In the case of the Lydiard Street North level crossing and gate configuration, neither the train controller located in Melbourne, nor the signalling system had the means of detecting that train 8185 was traveling at a speed that made it likely it would pass signal 20 at stop and enter the Lydiard Street crossing while it was closed to rail traffic. There were no effective safety controls in place to specifically mitigate against a train arriving at Ballarat Railway Station travelling at excessive speed and being unable to stop before colliding with the crossing gates closed against rail traffic.
About a second before the train passed through the crossing, the road traffic lights changed from showing a green indication to a flashing amber as the train occupied a track circuit[58] at the crossing. This was the only warning provided to road traffic.
Unique hazards associated with Lydiard Street North level crossing gates
The configuration of the crossing protection at Lydiard Street North level crossing, that used swing gates, introduced unique hazards when compared to boom barrier style crossing protection. Train 8185 was estimated to be travelling between 93 and 97 km/h when it struck the gates. The collision resulted in several events including impact with the driving cabin, side impact of the passenger compartment, and the projection of gate debris into surrounding public spaces.
Owing to the time of the collision and the movement restrictions associated with the Covid-19 pandemic, there were few pedestrians or road vehicles in the area, and there were none affected by the overrun or collision with the gates. The outcome to public outside the train may have been different in other circumstances.
The potential for impact with the gates was not documented in risk registers and risk controls were not in place to manage the unique risks associated with the gates at the Lydiard Street North level crossing.
Speed across 39 points
Train 8185 passed over 39 points on the approach to Ballarat Railway Station at a speed estimated to be in the range of 110 – 119 km/h. The turnout was rated for 40 km/h operations and routed trains to platform 1 at Ballarat Railway Station (Figure 31). The train crew recounted being thrown around when the train passed over the points.
Work undertaken for the Regional Fast Rail project by Transportation Technology Center, Inc (TTCI) for the Department of Infrastructure, Victoria (DOI 2006) calculated that the overturning speed for a VLocity train at an uncanted[59] 1:8.7 turnout, as installed at 39 points, was 117 km/h. This overturning speed assumed no crosswind and a loaded train. Train 8185 passed through this turnout at an estimated speed of over 110 km/h therefore having a significantly reduced margin to overturning and derailment.
The Australian standard for signalling principles (RISSB 2018), recognised the risk of rail traffic derailing owing to overspeed at points. The standard offered guidance for mitigating the risk, which included enforcement systems, such as Train Protection Warning System (TPWS). Train 8185, was equipped with on-board TPWS, as were all VLocity trains. However, the trackside TPWS components to enforce the speed restriction across 39 points were not installed.
In this instance, train 8185 was already in full-service braking from about 2.6 km before the intended stopping point, and at least 2 km before 39 points. Overspeed enforcement within this distance, and in the circumstances of very low adhesion conditions, may therefore not have reduced the train speed at the turnout.
Figure 31: Route taken by train 8185 via 39 points towards platform 1
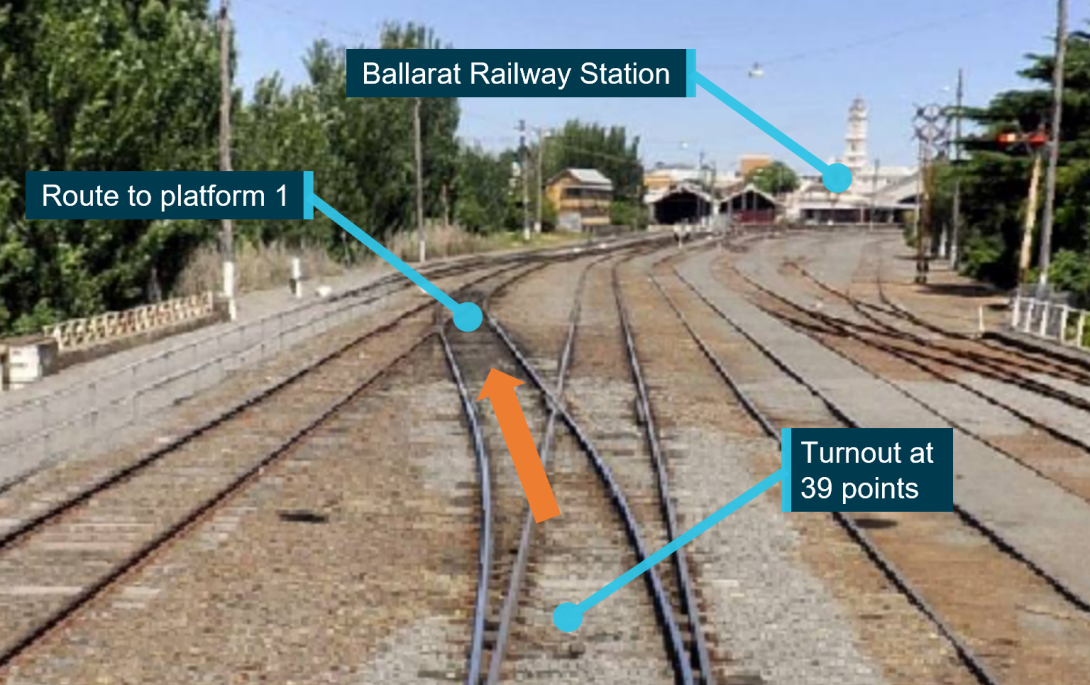
Source: Pass Assets (DoT, Vic), annotated by CITS
Driver expectations and response
Expectation
Adhesion conditions
The driver of train 8185 was familiar with the route into Ballarat Railway Station and had last driven it four days prior to the incident. The driver was also an experienced driver of the VLocity DMU and had experienced wheel slide conditions requiring WSP activations on previous occasions. However, the driver had not previously experienced extremely low levels of adhesion where the train’s speed could not be controlled by the braking, WSP and sanding systems. The driver of train 8185 had no reasonable means of knowing the extent of the extremely low adhesion conditions, nor that the sanding system would be ineffective at improving adhesion.
The braking records of train 8185 and train 8181, that preceded train 8185, were compared. The evaluation found that train 8185 was not able to achieve the retardation of train 8181 even though the brake application on train 8185 was significantly greater. With moderate brake application in the 2 km between 2.8 km and 800 m from the station, train 8181 achieved an average retardation of about 0.4 m/s2, with a peak retardation of about 0.6 m/s2 (Appendix I).
Sander performance
The driver was familiar with the sanding system on train 8185 and understood that it delivered sand to the rail to improve friction when either the WSP system triggered the sanding system to activate, or when sand was demanded manually by the driver using the foot pedal.
On the evening of the incident, the train provided the driver with an indication that the sanding system was delivering sand. However, the data recordings indicated that the adhesion remained extremely low and train deceleration under full-service brake application was between 20 and 30 per cent of expectation. The driver was presented with information that the sanders were operating and had no reasonable means of knowing that sander performance may have been affected by other factors, and was not improving adhesion conditions.
Information and driver training for low adhesion conditions
The Professional Driving Booklet provided some guidance on driving in low adhesion conditions, and an information notice on Braking in Slippery Track Conditions had been issued to VLocity drivers in 2013. The guidance on low adhesion conditions advised on allowing the WSP system to control the brake activation and not to release and reapply braking. Initially, the driver attempted to manage braking by release and reapplication as one might on a train not fitted with a WSP system. However, from approximately 2.6 km from the station stop, the driver afforded the WSP system the opportunity to manage the adhesion conditions.
The driver’s considerable experience and training did not prepare them for the extremely low adhesion conditions that existed at Ballarat at the time of the incident. While simulator training for the VLocity was provided by V/line, drivers did not receive driving simulator instruction in handling very low adhesion conditions as part of continuation training. It was technically feasible for the V/Line VLocity simulator to model low adhesion conditions.
Findings
|
ATSB investigation report findings focus on safety factors (that is, events and conditions that increase risk). Safety factors include ‘contributing factors’ and ‘other factors that increased risk’ (that is, factors that did not meet the definition of a contributing factor for this occurrence but were still considered important to include in the report for the purpose of increasing awareness and enhancing safety). In addition, ‘other findings’ may be included to provide important information about topics other than safety factors. Safety issues are highlighted in bold to emphasise their importance. A safety issue is a safety factor that (a) can reasonably be regarded as having the potential to adversely affect the safety of future operations, and (b) is a characteristic of an organisation or a system, rather than a characteristic of a specific individual, or characteristic of an operating environment at a specific point in time. These findings should not be read as apportioning blame or liability to any particular organisation or individual. |
From the evidence available, the following findings are made with respect to the collision of passenger train 8185 with level crossing gates at Ballarat, Victoria, on 30 May 2020.
Contributing factors
- Very low levels of adhesion existed between the wheels of train 8185 and the rail head on the approach to Ballarat Railway Station. A small amount of rail head moisture was probably the primary environmental factor in the development of low adhesion conditions.
- The sanding system on train 8185 did not effectively improve wheel-rail adhesion during braking of the train on its approach to Ballarat Railway Station.
- Safety controls were ineffective in mitigating against a train arriving at Ballarat Railway Station travelling at excessive speed and being unable to stop before colliding with the crossing gates closed against rail traffic. [Safety issue]
Other factors that increased risk
- The location of sanding nozzles (for braking) behind the wheels of the lead bogie was inconsistent with design practice existing at the time of the collision and was probably a recurring factor in diminished sander effectiveness on VLocity trains. [Safety issue]
- Neither V/Line nor Bombardier identified during type testing of the three-car VLocity in 2008 that the sanding system may not reduce stopping distances in low adhesion conditions. The results of type testing did not show any statistically significant difference in the stopping distance with or without the sanding system operational.
- There was no suitable assessment of the performance of sanders on the VLocity three-car set against defined acceptance criteria for improved braking performance in low adhesion conditions. [Safety Issue]
- V/Line investigation of previous rail safety occurrences that involved poor wheel-rail adhesion did not include examination of the train sanding system or assessment of sander performance and its potential contribution to the overrun events.
- The sanding mechanism of all sanders on train 8185 was partially blocked by vegetation. Testing showed that flow rates were affected by the vegetation, and that suitable rates were achieved when vegetation was removed.
- Maintenance of the VLocity sander units did not include testing of sand discharge flow rates (or some other process) to confirm performance. Without performance checks over time, deficiencies could not be identified and addressed. [Safety Issue]
- The car 1270 side B sand box of train 8185 was probably no more than half full on leaving Southern Cross Station and functionally empty on arrival at Ballarat.
- The processes involved in train preparation did not ensure a required minimum amount of sand in sand boxes. [Safety Issue]
- Loss of adhesion leading to increased stopping distance was not recognised as a risk source for any type of collision in V/Line’s risk registers. [Safety issue]
- Train 8185 passed through 39 points and the associated turnout at a speed estimated to be greater than 110 km/h. This reduced its margin for navigating this turnout safely, and without overturning or derailment.
Other findings
- Comparison with experiments conducted on sander nozzle discharge position found that the nozzles on car 1270 were higher and more longitudinally offset from the wheel-rail contact point than all tested samples. Research indicates that the height and offset of the sander nozzle outlet relative to the wheel-rail contact point influences the proportion of sand deposited on the rail.
- Winds at the time of the event were strong and orientated across the direction of travel of train 8185 as it approached Ballarat Railway Station. Research indicates that even moderate crosswinds can influence the amount of sand reaching the rail.
- The driver did not have information on the severity of the very low wheel-rail adhesion that would exist on the approach to Ballarat, limiting their ability to take informed action.
- The driver did not have information about the ineffective sander performance, limiting their ability to take informed action.
- V/Line drivers did not receive ongoing driving simulator instruction in handling very low adhesion conditions.
Sources and submissions
Sources of information
The sources of information during the investigation included the:
- V/Line
- V/Line personnel
- Event recorders from train 8185 and other V/Line trains
- Bombardier sanding test results
- Monash Institute of Railway Technology (IRT) track inspection and measurements
- Bureau of Meteorology
- Environmental Protection Agency (Vic)
- CCTV footage from Ballarat Railway Station
- Photographs taken on the day after the incident
References
BTA (Bombardier Transportation Australia) (n.d.) Vlocity Technical Specification 3EAM919567 .
BTA (Bombardier Transportation Australia) (2003) Technical Specification for Diesel Railcar Sets For V/Line Passenger Services 3EAM 0-0042, issue 8E.
BTA (Bombardier Transportation Australia) (2006) Body to bogie motor bogie attachment 3EAM 200563, revision K
BTA (Bombardier Transportation Australia) (2008). Vlocity Type Test Procedure Slip / Slide, 3EAM904906.
BTA (Bombardier Transportation Australia) (2008b). Vlocity Type Test Report Slip / Slide, 3EAM905030.
BTA (Bombardier Transportation Australia) (2014). 3EAM-0300 VLocity DMU routine test procedure, revision 9.
BTA (Bombardier Transportation Australia) (2017). VLocity DMU Technical Specification Knorr Brake System, revision 7.
British Rail Specification (1978) BR 566 – Specification for High Impact Windscreens, U.K.
CEN (European Committee for Standardization) (2009). EN15663 Railway applications - Vehicle reference masses, Belgium.
CEN (European Committee for Standardization) (2018) EN15595 Railway applications – Braking – Wheel Slip Protection, Belgium.
DOI (Department of Infrastructure, Victoria) (2006). Regional Fast Rail Project: Turnout Safety Analysis, prepared by TCCI (Transportation Technology Center, Inc), U.S.A
FRA (Federal Railroad Administration) (1980), Standard 49 CFR 223 Safety Glazing Standards - Locomotives, Passenger Cars and Cabooses. Department of Transportation, U.S.A.
FRA (Federal Railroad Administration) (2017), A survey of wheel/rail friction, Department of Transportation, U.S.A.
IRT (Monash Institute of Railway Technology) (2020), Ballarat rail measurements for V/Line Pty Ltd, Report No: Monash/RT/2020/1521, Australia.
Lewis SR, Riley S, Fletcher DI and Lewis R (2018) ‘Optimisation of a railway sanding system for optimal grain entrainment into the wheel–rail contact’. Proc IMechE Part F: J Rail and Rapid Transit 2018, Vol. 232(1) 43–62.
OCI (Office of the Chief Investigator, Transport Safety) (n.d.) Platform overruns Siemens Nexas EMU Connex / Metro Trains Melbourne, Rail Safety Investigation, Report No 2009/05.
Olofsson U, Zhu Y, Abbasi S, Lewis R and Lewis S (2013). Tribology of the wheel−rail contact – aspects of wear, particle emission and adhesion. Vehicle System Dynamics. 51. 1091-1120.
ONRSR (Office of the National Rail Safety Regulator) (2019) Reporting requirements for notifiable occurrences, Australia.
RAIB (Rail Accident Investigation Branch) (2005) Autumn Adhesion Investigation Part 3: Review of adhesion-related incidents, U.K.
Railway Safety (2001) Sanding Equipment Fitted to Multiple Units and On-Track Machines Railway Group Standard GMRT2461, Issue 1, U.K.
RISSB (Rail Industry Safety and Standards Board) (n.d.) Hazard register, RISSB website, accessed 8 March 2022.
RISSB (Rail Industry Safety and Standards Board) (2014), AS 7510.3:2014 Braking Systems on Multiple Unit Passenger Rolling Stock, Queensland.
RISSB (Rail Industry Safety and Standards Board) (2018), AS 7711:2018 Signalling Principles, Rail Industry Safety and Standards Board, Queensland.
RISSB (Rail Industry Safety and Standards Board) (2020) AS 7658:2020 Level crossings – rail industry requirements, Queensland.
RSSB (Rail Safety and Standards Board) (2009) Understanding the current use of sanders on multiple units, Research Report T796’, U.K.
RSSB (Rail Safety and Standards Board) (2014) Investigation into the effect of moisture on rail adhesion, Research Report T1042’, U.K.
RSSB (Rail Safety and Standards Board) (2018) Trial of sander configurations and sand laying rates, Research Report T1107’, U.K.
RSSB (Rail Safety and Standards Board) (2021) Sanding Equipment Railway Group Standard GMRT2461 Issue 3.1, U.K.
Standards Australia (1995), Safety glass for land vehicles, AS 2080, Standards Australia, NSW.
Transit Cooperative Research Program (TCRP) (1997) ‘Improved Methods for Increasing Wheel/Rail Adhesion in the Presence of Natural Contaminants’, Research Results Digest 17.
Veerbeck H (1973) ‘Present knowledge of adhesion and its utilization’, Rail International, No 6.
VRIOG (Victorian Rail Industry Operators Group Standards) (2010) 12.0.1 Signalling Principles – Overlaps, Victoria.
V/Line (n.d.) Professional Driving Booklet MSR01345
V/Line (2013) VLocity Information Notice V38: Braking in Slippery Track Conditions.
V/Line (2016) VLocity DMU - Operator’s manual, revision 4.
V/Line (2017) Rail and Wheel Profiles,. NIST-2621, Revision 1.
V/Line (2019) Work Instruction VEWI-79 VLocity servicing schedule, revision 5.
Submissions
Under section 26 of the Transport Safety Investigation Act 2003, the ATSB may provide a draft report, on a confidential basis, to any person whom the ATSB considers appropriate. That section allows a person receiving a draft report to make submissions to the ATSB about the draft report.
A draft of this report was provided to the following directly involved parties:
- V/Line
- The crew of train 8185
- Alstom (Bombardier were acquired by Alstom)
- ONRSR
- RISSB
- City of Ballarat
- Department of Transport (Vic)
- Monash Institute of Railway Technology
Submissions were received from the driver of train 8185 and all consulted organisations. Submissions were reviewed and, where considered appropriate, the text of the report was amended accordingly.
Appendices
Appendix A – Sand box configuration and operation
The sander fitted to the VLocity used compressed air to agitate the sand in the sand box and discharge the sand at a metered rate through the discharge nozzle (Figure 33).
Figure 33: Air and sand flow controlled by sand box metering unit
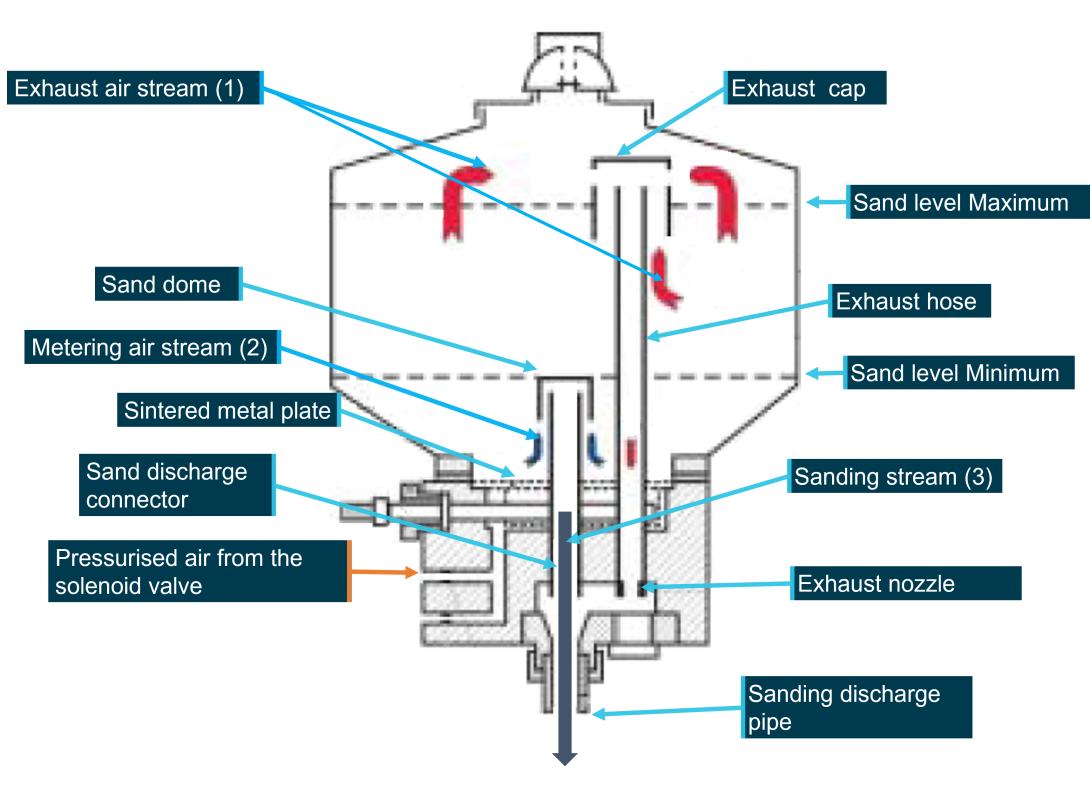
Source: CITS, adapted from diagram by Knorr-Bremse (not to scale)
When operating, pressurised air was supplied from the main reservoir into the sand box through a sintered plate. Inside the sand box, the air supply stream divided into two streams, the exhaust air stream (1), and the metering air stream (2). The exhaust air stream agitated the sand in the sand box to make it flow more readily and was returned to the manifold through the exhaust cap and hose. The metering air stream flowed through the sand dome and conveyed the sand through the sanding discharge pipe at the base of the sanding unit.
Appendix B – Sand used and comparison with guidelines
Sand specification
The sand used in VLocity sanders was silica sand, sourced from local sand quarries and screened to a specified grain size. The sand was specified as 16/30 and was sized according to a sieve analysis (Table 6). The sand was also specified to have a maximum uniformity coefficient of 1.6.[1]
Table 6: Size specification for sand used on VLocity
| Sieve size (mm) | 1.700 | 1.400 | 1.180 | 1.000 | 0.850 | 0.600 | 0.425 |
| Per cent passing (by weight) | 100 | 99.9 | 98.2 | 88.5 | 70.3 | 12.3 | 2.1 |
Source: V/Line
Comparison with sand standards for braking applications
The Rail Industry Safety and Standards Board (RISSB) standard for braking systems on multiple unit passenger rolling stock (RISSB 2014), stated that:
Sanding systems should, in general, conform to the requirements of GM/RT2461.
Standard GM/RT2461 (RSSB 2021) was developed as a Railway Group Standard in Great Britain and specified requirements for sand types to be used in both braking and traction sanders. The standard advised that coarse/medium grain size sand was more suitable for use in braking sanders owing to the grain size tending to be larger than the rail contaminant layer and providing a mechanical link between the wheels and rails.
The standard stated that the sand for braking sanders should have a uniformity coefficient less than 1.5, and that the maximum proportion of grains with a diameter of less than 0.71 mm should not exceed 5 per cent by weight. A sieve analysis conducted by the supplier of sand for the VLocity trains found that approximately 45 per cent of the sand had a diameter of less than 0.71 mm. The sand used for the VLocity trains was therefore finer than that specified by GM/RT2461 (RSSB 2021). Research and standards suggest the sand used was probably better suited to addressing wheel spin rather than wheel slide.
Appendix C – Measurement of sander flow rates on other VLocity
Other overrun events examined
An examination was made of sanders fitted to nine VLocity trains involved in 10 overrun events between April 2010 and June 2020. There were 66 reported overrun events involving VLocity trains during this period. The 10 incidents selected for further analysis involved trains that experienced overruns of greater than 100 m, or events that were on the same day.[2] Several of the overrun events were in the Macedon (Ranges), and the others distributed (Table 7).
Table 7: Significant VLocity overshoot events selected for further analysis, by location
| Location | Macedon | Trafalgar | Drouin | Rochester | Riddles Ck |
| Number of events | 5 | 2 | 1 | 1 | 1 |
Source: V/Line
Results of sander flow tests
The sand flow rates from the four sanders fitted on each of the nine trains selected were measured in testing conducted in July 2020 (Table 8). The flow rates were first measured without unit maintenance (36 tests). Fifteen of the 36 units tested did not meet the desired sand delivery output of between 1.5 to 2 kg/min on their initial flow tests. For those units where the desired flow rate was not achieved (in italics in Table), the sanding system was subjected to maintenance[3] until a desired sand flow rate was achieved. Where the flow rate of between 1.5 and 2 kg/min was achieved on initial testing, the system was generally not tested a second time.
Table 8: Sand flow measurements of nine VLocity sets involved in overruns
| First sand flow measurements (kg/min), conducted July 2020 | Second sand flow measurements, after maintenance (kg/min) | |||||||||
| Unit No. | DM(D) Side A | DM(D) Side B | DM Side A | DM Side B | DM(D) Side A | DM(D) Side B | DM Side A | DM Side B | ||
| VL23 | 1.95 | 1.65 | 1.75 | 1.75 | [1] | [1] | [1] | [1] | ||
| VL12 | 0.94 | 1.635 | 1.8 | 1.5 | 1.63 | 1.625 | [1] | [1] | ||
| VL64 | 1.69 | 1.16 | 0.83 | 0.02 | 1.9 | 1.97 | 1.99 | 1.92 | ||
| VL66 | 0.98 | 1.12 | 0.66 | 0.13 | 2.14 | 2 | 1.92 | 2.25 | ||
| VL15 | 1.05 | 0.95 | 0.25 | 1.05 | 1.75 | 1.55 | 1.85 | 1.65 | ||
| VL01 | 2.08 | 1.89 | 1.74 | 1.95 | [1] | [1] | [1] | [1] | ||
| VL03 | 1.95 | 1.95 | 1.9 | 2 | [1] | [1] | [1] | [1] | ||
| VL26 | 1.61 | 0.07 | 1.5 | 1.65 | 1.6 | 1.6 | [1] | [1] | ||
| VL50 | 0.11 | 1.64 | 2.08 | 0.78 | 2.06 | 1.78 | 2.15 | 2.03 | ||
[1] No data recorded as expected sand flow rate was met in the first test. Source: V/Line, Bombardier.
Appendix D – Information on driving in low adhesion conditions
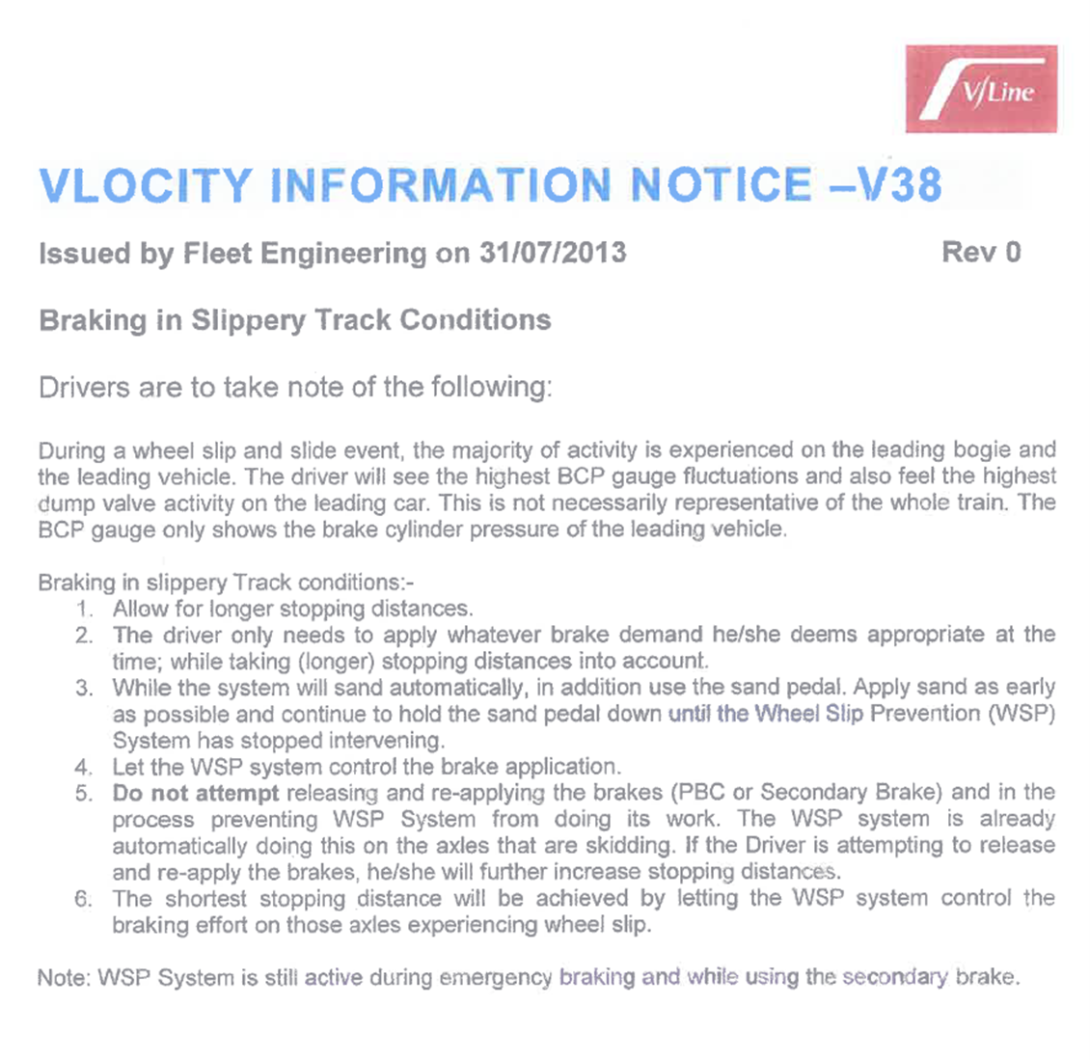
Appendix E – Retardation during full-service brake application
The period of consistent full-service braking has been used to estimate the average retardation of train 8185 achieved during this period.[4]
For this period, a train retardation of about 0.2 m/s2 (represented by the slope of the blue dashed line) was achieved compared to a full-service braking rate in dry conditions of 0.95 m/s2 (Figure 34).
Figure 34: BCU, pulse and speed estimated from GPS, from 2.5 km to 450 m from intended stopping point at Ballarat Railway Station.
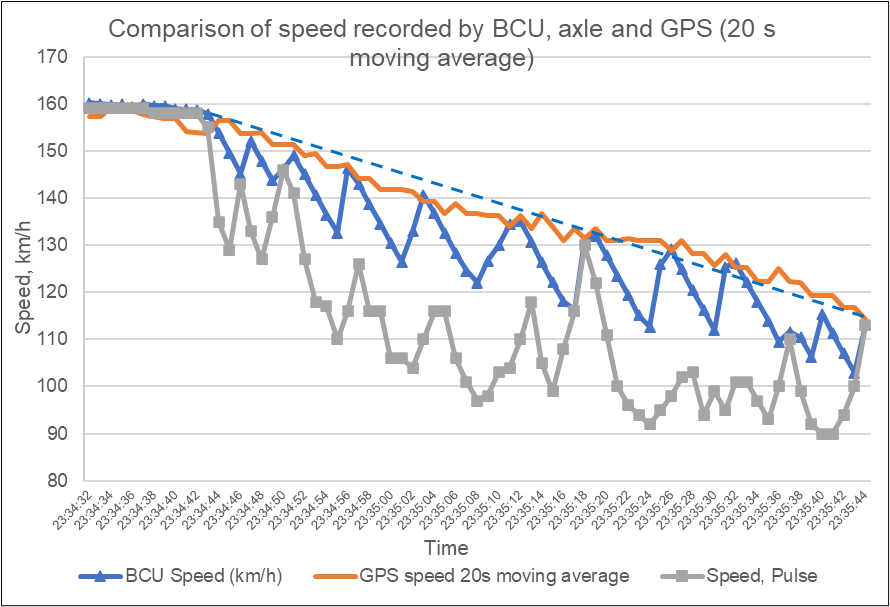
The figure shows a comparison of the BCU speed with pulse speed and the speed estimated from GPS recordings. The pulse speed is the speed recorded by one of the third axle on car 1270, whereas the BCU speed represents the speed of the fastest rotating axle on that car. The dashed line represents an estimate of the average reduction in speed over the period.
Source: CITS, based on train 8185 event recorder and GPS data
The level of adhesion has been estimated as the ratio of the longitudinal force and normal force (weight). Considering grade, available adhesion experienced by train 8185 was estimated to probably be between 0.02 and 0.03 on the approach of train 8185 to Ballarat Railway Station. This reflects very low to extremely low levels of friction and compares to a required adhesion at the wheel-rail interface for full-service braking retardation of at least 0.1.
Appendix F – Test data on implications of nozzle position
Experiments were identified that measured the amount of sand delivered to the rail head for different nozzle positions (Lewis et al. 2018). Tests were conducted with a 25 mm diameter hose fitted with a nozzle and the nozzle at various positions relative to nip and rail. Tests were conducted under dry conditions, with the discharge nozzle in front of wheel at a 15-degree angle to the rail, and a 48 km/h longitudinal wind.
The height and distance of the nozzle from the wheel-rail contact point was found to influence the proportion of the sand reaching the interface (Figure 35).
Figure 35: Mass of sand deposited on rail for different nozzle positions
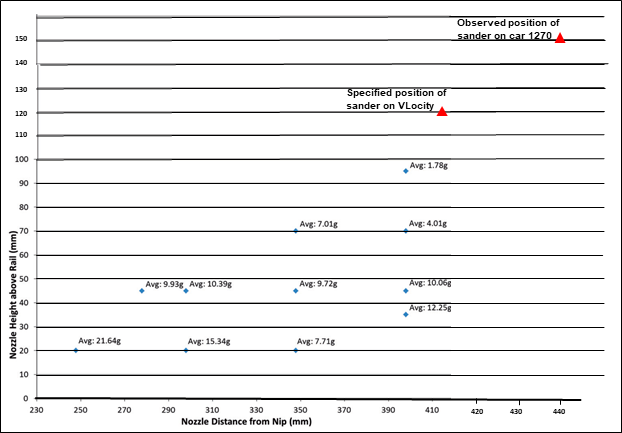
Source: Lewis et al (2018). adapted by CITS
The specified position for the VLocity discharge nozzle and the actual position of the nozzles on car 1270 of train 8185 were plotted alongside the test results for reference. Direct qualitative comparison with the test results was not possible given the difference between test conditions and the sander orientation on car 1270.
Appendix G – Performance testing on sanders in Great Britain
Testing of sanding systems by Rail Safety Standards Board (RSSB)
In 2009, the RSSB published research that evaluated the performance of sanders on multiple units in Great Britain (RSSB 2009). The findings showed that there was considerable variability in performance of sanding systems with many operating well below the 2 kg/min discharge rate recommended by guidance in issue 1 of GM/RT2461 (Railway Safety 2001). The large variation in discharge rates reported by RSSB was thought to be due to several factors, including discharge hose length, hose bore diameter, nozzles fitted to the end of discharge hoses, dampness of sand, and design of sand storage hoppers. The report specified the lack of regular maintenance and ineffective design as causes for sanding systems not dispensing the required amount of sand. The testing also suggested that performance may deteriorate over time.
Comparison between RSSB data and VLocity measurements
The RSSB test result distribution was compared with the 36 tests conducted by Bombardier in July 2020 on nine VLocity sets (Figure 36). The mean discharge rate from 330 RSSB tests was 1.148 kg/min, that was similar to the VLocity mean of 1.236 kg/min. Figure 36 shows the distrution of sanding rates for SDN14 units which are equivalent to those installed on VLocity trains.
Figure 36: Comparison of sanding rates - RSSB (2009) and Bombardier tests on VLocity

Source: CITS, Bombardier, RSSB
Appendix H – Risk mitigation for rail overruns of level crossings
Australian level crossing standard
Noting that the version cited was not published at the time of the incident, the Australian level crossing standard[5] stated the requirement that rail traffic shall have priority over road and pedestrian traffic at level crossings. For the hazard associated with a train passing a signal displaying a stop indication (SPAD), the standard stated the following possible mitigation:
New level crossings should be located beyond a signals safety zone (overlap).[6] Existing signals may be relocated to meet the necessary safety zone (overlap). Train protection systems may also be a mitigation.
The Ballarat Railway Station precinct dates to the nineteenth century and the crossing gates at Lydiard Street North were not located beyond the safety zone of signal 20. The standard identified train protection systems as also a possible mitigation.
Australian standard for signalling principles
The Australian standard for signalling principles, AS 7711:2018 (RISSB 2018), also considered the risk of a signal near a crossing and stated:
Where the position of a signal presents the risk of a significantly reduced crossing warning time in the event of the overrun of a signal additional controls should be considered to mitigate the risk.
AS 7711:2018 also advised that:
…predictive systems can be used to activate the crossing where overspeeding is detected on the approach to the stop signal.
Appendix I – Comparison of braking on trains 8185 and 8181
Graphical presentation of braking profiles
The approach of train 8185 into Ballarat was compared with the previous train that evening, train 8181 (Figure 37). Both trains were three-car VLocity trains and braking on both was initiated about 5 km from the intended stopping point, and when the trains were travelling at around 160 km/h.
Figure 37: Speed (BCU)[7] and braking profile comparison of trains 8185 and 8181
![Figure 37: Speed (BCU)[7] and braking profile comparison of trains 8185 and 8181](/sites/default/files/styles/wide/public/2022-11/RO-2020-007%20Figure%2037.png?itok=POutsnve)
Source: CITS (from data provided by V/Line)
Comparison of braking profiles
The approach of train 8181 and its arrival at the station were unremarkable and no activation of either the WSP system or of sanding was observed. The train speed was reduced in increments as the train approached the 40 km/h-limited crossover that directed the train onto the track for the № 1 platform. Between 2.8 km and 800 m from the station stop, brake applications were between 70 per cent and 20 per cent of a full-service application, except for a short application at about 80 per cent.[8] During this period, the average retardation of train 8181 was about 0.4 m/s2, with a peak retardation of about 0.6 m/s2. The train coasted to the platform for a normal stop.
From approximately 2.6 km before the intended stopping point, the driver of train 8185 made a full-service brake application. However, average retardation achieved was only about 0.2 m/s2 and insufficient to slow the train for the intended stop. This compares to the 0.4 m/s2 retardation of train 8181 with significantly less brake demand.
Purpose of safety investigationsThe objective of a safety investigation is to enhance transport safety. This is done through:
It is not a function of the ATSB to apportion blame or provide a means for determining liability. At the same time, an investigation report must include factual material of sufficient weight to support the analysis and findings. At all times the ATSB endeavours to balance the use of material that could imply adverse comment with the need to properly explain what happened, and why, in a fair and unbiased manner. The ATSB does not investigate for the purpose of taking administrative, regulatory or criminal action. TerminologyAn explanation of terminology used in ATSB investigation reports is available here. This includes terms such as occurrence, contributing factor, other factor that increased risk, and safety issue. Publishing informationReleased in accordance with section 25 of the Transport Safety Investigation Act 2003 Published by: Australian Transport Safety Bureau © Commonwealth of Australia 2022
Ownership of intellectual property rights in this publication Unless otherwise noted, copyright (and any other intellectual property rights, if any) in this report publication is owned by the Commonwealth of Australia. Creative Commons licence With the exception of the Coat of Arms, ATSB logo, and photos and graphics in which a third party holds copyright, this publication is licensed under a Creative Commons Attribution 3.0 Australia licence. Creative Commons Attribution 3.0 Australia Licence is a standard form licence agreement that allows you to copy, distribute, transmit and adapt this publication provided that you attribute the work. The ATSB’s preference is that you attribute this publication (and any material sourced from it) using the following wording: Source: Australian Transport Safety Bureau Copyright in material obtained from other agencies, private individuals or organisations, belongs to those agencies, individuals or organisations. Where you wish to use their material, you will need to contact them directly. |
[1] A numerical expression of the variety in particle sizes, defined as the ratio of the sieve size through which 60 per cent (by weight) of the material passes to the sieve size that allows 10 per cent of the material to pass. It is unity for a material whose particles are all of the same size, and it increases with variety in size
[2] Events with overruns of greater than 100 m and events that were on the same day were selected based on the assumption that these would have a greater probability of being low-adhesion events rather than another type of error.
[3] Maintenance involved addressing any air leaks and removing air flow restrictions.
[4] There was a period of about 4 s during the 66 s period when braking was reduced below full-service braking.
[5] Rail Industry Safety and Standards Board (2020), AS 7658:2020 Level crossings – rail industry requirements. This standard was published after the Ballarat incident.
[6] The Victorian Rail Industry Operators Group standard for overlaps (VRIOG 2010), stated the minimum overlap length is the longest of the emergency braking distances of the train types being considered, from the authorised speed at the warning aspect to the target speed at the end of overlap, plus a 10 per cent distance safety margin. The standard also stated the minimum mainline overlap length shall be 100 m for line speeds up to and including 40 km/h
[7] The speed graphed is that of the fastest rotating axle on car 1270 (the BCU speed). For train 8185, this speed did not represent the actual train speed at the points when all axles were sliding.
[8] Based on recorded brake demand, expressed as a percentage of the maximum 64 kN.
[1] A Victorian Government owned corporation.
[2] All times are Australian Eastern Standard Time (AEST).
[3] Under braking, when wheel rotational velocity is less than what would correspond to the actual velocity of the train.
[4] When applying traction power, and wheel rotational velocity is greater than what would correspond to the actual train.
[5] During wheel slide activity, train recorded speeds are unreliable. GPS data has been used to assist speed estimation.
[6] From this point, the WSP system remained activated until the train came to a stop after the collision.
[7] The lights would have been flashing for approximately 22 s, compared to a minimum warning time at the crossing of 26 s under normal conditions
[8] An electric circuit where current is carried through the rails and used to detect the presence of trains. Track circuits are used in the operation and control of points and signalling equipment.
[9] The front windscreen was equipped with glass fabricated to comply with the requirements of BR 566 – ‘Specification for High Impact Windscreens’ type 2.
[10] All side facing glazing were single glazed, and of a single laminated construction in compliance with AS 2080 Appendix K (Standards Australia 1995). The glass was also specified to comply with the impact performance requirements of FRA Standard 49 CFR 223 Type II (FRA 1980).
[11] PM10 are very small particles found in dust and smoke. They have a diameter of 10 micrometres (0.01 mm) or smaller.
[12] Broad gauge on the V/Line network is nominally 1600 mm. The RFR track on the approach to Ballarat was measured, on average, at about 1593 mm. The tight gauge was associated with sleeper manufacture.
[13] If a train passed a signal at danger (stop) without authority, TPWS TSS would initiate an emergency brake demand on those trains fitted with the compatible train-borne equipment. VLocity trains are fitted with such equipment.
[14] Facing points are points with the switch blades facing approaching rail traffic.
[15] The mechanical system to operate the gates was retained in the Ballarat B signal box for emergency use.
[16] Trains travelling away from Melbourne
[17] In 2021, Alstom announced the completion of the acquisition of Bombardier Transportation, which included Bombardier Australia.
[18] Items addressed in the preparation process were listed in the Operator’s Manual (V/Line 2016). When making rollingstock ready for service, the preparation driver was required to sign a pro-forma signifying fulfillment of this process. This record was then archived. There was no checklist of individual items completed by the preparation driver as part of this task.
[19] A brake demand at the full-service level of 64 kN was not the brake force actually applied (due to WSP activation, see wheel slip/slide protection description) but was rather the driver brake control setting.
[20] The speed graphed is the BCU speed, based on the fastest rotating axle on car 1270. The regular sudden drop in BCU speed represent axles being in wheel slide during the systems attempts to apply braking force at the wheels. These sudden dips in the BCU speed do not represent an actual reduction in train speed.
[21] Distances are estimated from logged train GPS location data
[22] The brake demand is described here as a percentage of the maximum value of 64 kN.
[23] The full-service brake cylinder pressure on a VLocity car is approximately 300 kPa. ‘Full-service’ is the term for a maximum brake application under normal (non-emergency) running conditions.
[24] The train horn was sounded a number of times through this phase of the approach into Ballarat.
[25] Emergency braking is designed to disable dynamic brake and exhaust the brake pipe, increasing the deceleration from nominally 0.95 m/s2 to 1.1 m/s2 on dry, level, tangent track.
[26] The reasons for a short period of recorded sander inactivity from about 23:35:44 (as logged) was not determined.
[27] The MP2 wheel profile was originally developed for use on the disc braked passenger rolling stock which operate on the Metropolitan Melbourne network.
[28] Wheel hollowing is where the wheel surface in contact with the rail is gradually worn to form a hollow shape. The wheel tread is worn below the level of the end of the thread.
[29] Site locations measured from Melbourne. Lydiard Street North level crossing was located at a chainage of 113.923 km.
[30] Intended height difference in the rails.
[31] The down rail is the left side rail when travelling from Melbourne to Ballarat. The up rail is the left side rail when travelling from Ballarat to Melbourne.
[32] The rail profile specified for this section was RTG2000 (V/Line 2017).
[33] Push tribometer instruments were generally known to provide higher friction measurements than full scale wheel-rail tests, primarily due to differences in contact geometry, creep behaviour and speed. IRT guidance of around a 39 per cent reduction for a train travelling at 160 km/h referenced Veerbeck (1973). Other research also notes that adhesion was governed by the characteristics of the interfacial layer and the amount of moisture present, and the effect of speed on the interfacial layer was not clear (Federal Railroad Administration 2017).
[34] The geometric analysis did not consider effects of vehicle dynamics, load imbalance, track geometry irregularity or wheelset angle of attack. While these may have had an effect, it would not be expected to be as significant as the geometric conditions.
[35] Wheel 1 is the front right wheel in the direction of travel. Wheel 8 is the front left wheel.
[36] Wheel 3 is the third right wheel of the car in the direction of travel. Wheel 6 is the third left wheel of the car.
[37] Three likely contact scenarios were considered, referenced as 1mm offset, 2 mm offset and 3 mm offset from flange contact condition.
[38] Braking equipment that enables a train driver to apply variable retardation by the utilisation of the transmission system of a train fitted with a hydraulic power transmission system (RISSB 2014).
[39] Hydrodynamic braking on the VLocity is only available above 40 km/h. Below this speed, the braking is by friction braking.
[40] Emergency braking could be applied through the power/brake controller, an emergency push button located in the cab at either end of the train, a secondary brake controller, the emergency brake cock, or (if triggered) via other systems such as TPWS or the train’s vigilance control.
[41] The European standard for wheel slide protection (CEN 2018) stated that if the adhesion remained at an extremely low level, alternative strategies of WSP control may be adopted. For example, controlling the axles at different levels of slide or allowing the wheelsets to lock.
[42] The routine test procedure did not specify a test for the independent monitoring function, as described in the technical description of the VLocity braking system (Bombardier 2017).
[43] 3.9 kg is approximately the sand minimum level to dispense sand from the sand box. A small amount of sand was dispensed during a functional test prior to this measurement, and the box may therefore have contained slightly more sand than this measured value.
[44] The same sand was supplied for tests as that used for filling sand boxes on VLocity trains during maintenance.
[45] Vehicle load condition based on the design mass in working order in accordance with European Committee for Standardization standard EN 15663 (CEN 2009).
[46] The testing specification did not require a specific level of wheel-rail adhesion to be achieved by the mix.
[47] The terminology of precursor and source of hazard is consistent with that used in the RISSB hazard register.
[48] The braking was briefly reduced for about 3 s during this 66 s period of full-service brake application.
[49] The level of adhesion has been estimated as the ratio of the longitudinal force and normal force (weight).
[50] Moisture, even in small amounts, on the rail surface is the single most important contaminant responsible for loss of adhesion (TRCP 1997).
[51] Conducted on the day following the overrun incident.
[52] The two-car VLocity trains were acquired as part of an operator franchise commitment. The operator at the time of the initial technical specification for the two-car VLocity was National Express Group Australia (V/Line Passenger) Pty Ltd.
[53] A full sand box contains about 25 kg of sand.
[54] The actual amount of sand in the sand boxes was slightly more than that recorded, due to a small amount of sand being lost during a functional test after the event and before the measurement of the amount of sand remaining.
[55] Based on a maximum potential flow rate of 2 kg/min, it was estimated that the sanding mechanism on side B could have dispensed up to 9 kg on this journey.
[56] Target flow rate advised by V/Line.
[57] Discharge rate of 2 kg/min contained in guidance in issue 1 of GM/RT2461 (Railway Safety 2001)
[58] An electric circuit where current is carried through the rails and used to detect the presence of trains. Track circuits are used in the operation and control of points and signalling equipment.
[59] Cant is the intended height difference in the rails (i.e. where the track is inclined in a curve).
|
Whether or not the ATSB identifies safety issues in the course of an investigation, relevant organisations may proactively initiate safety action in order to reduce their safety risk. The ATSB has been advised of the following proactive safety action in response to this occurrence. |
V/Line has advised the ATSB that it has continued driver communication regarding driving in low adhesion conditions.


