
Investigation summary
What was done
As part of the investigation into the midair collision involving 2 Eurocopter[1] EC130 B4 helicopters, VH‑XH9 and VH‑XKQ, at Main Beach, Gold Coast, Queensland on 2 January 2023, (ATSB Investigation AO-2023-001), the ATSB sought to identify what limitations or opportunities the pilots had to visually detect and avoid the other aircraft. That is, to gain a more detailed understanding of whether the ‘see-and-avoid’ principle, with its known limitations, could have been effective for the pilots of these 2 helicopters in avoiding the collision.
To examine this aspect in detail, the ATSB initiated a cockpit visibility study to examine when each aircraft would likely have been visible to the other pilot. It examined the impact of aircraft structure, pilot positioning and apparel, local environment, visual conspicuity devices and human performance on the opportunity for detection.
The study involved a review of available literature covering the ‘see-and-avoid’ concept, human visibility limitations and helicopter conspicuity. A detailed 3-dimensional model of an exemplar helicopter was used to determine the relative position of the aircraft structure within each pilot’s field of view. To calculate the opportunity for detection, a detailed analysis of onboard data was performed to calculate the relative size, position and closing speed between the 2 helicopters. This was combined with an assessment of elements of the helicopters that could impact visual conspicuity.
Finally, an animation was developed in collaboration with Airbus Helicopters and a simulation expert at iwiation GmbH in Germany. This animation represented the view from the pilot’s eye position in each aircraft in the lead‑up to the collision and demonstrated the opportunities for detection that the pilots probably encountered.
Throughout the development of the study and accompanying animation multiple data verification processes were employed to ensure that, within the limitations outlined in this report, the analysis aligned with the actual events. This included:
- cross‑validation between the results of the visibility study analysis and animation that were developed using separate techniques
- validation of aircraft position, orientation and pilot’s eye position against cameras on board XKQ and XH9
- validation of aircraft position and orientation against multiple external cameras
- validation of results against ATSB wreckage analysis and the pilot of XH9’s comments.
This study does not consider aspects of the pilots’ mental models or the potential impact of electronic conspicuity devices. These aspects are addressed in detail in the investigation report.
What the ATSB found
The study determined that from the pilots’ eye positions it was unlikely that either pilot could have detected the other aircraft at critical times in the lead‑up to the collision. This was primarily due to obscuration from the aircraft structure but was also impacted by the relative position and visual size in the simulated pilots’ fields of view, pilots’ apparel, environment and aircraft fitment. Sensitivity analysis showed that the opportunity for detection would have been improved if the pilot’s eye position had been alternately positioned and the head and eyes rotated towards the approaching aircraft at the correct time. This could have both reduced structural shielding and moved the approaching aircraft towards the centre of the pilot’s field of view where detection was more likely.
The study also determined that from the pilot’s eye position, it was unlikely that the cap worn by the pilot of XKQ interfered with the opportunity to detect XH9 and that the cap’s presence likely improved the pilot’s visual acuity by blocking the sun that was positioned through the aircraft’s skylight. However, the sensitivity analysis showed that depending on eye position and head rotation, the cap could have interfered with detection opportunity.
Finally, there were several visual conspicuity devices either fitted or available for fitment that could have been used to improve the opportunity for detection. This included high ‑visibility rotor blades to XKQ, strobe lights for both aircraft and high or higher visibility paint schemes.
Safety message
Visual acquisition is one of the primary tools at a pilot’s disposal to assist them in the location and identification of traffic around them. However, as shown by this study and a volume of previous work, it is highly dependent on the relative location and speed of the other aircraft, the layout and fitment of both aircraft, a range of human performance characteristics, what information is available to the pilot as well as being dependent on what the pilot is doing at that moment. Pilots need to be aware of these limitations and realise that other aircraft in the same airspace will not always be sighted, even when active external visual scans are routinely used. However, these limitations can be offset. The expectation of the presence and approximate location of other aircraft through communications or onboard electronic detection systems has been shown to greatly enhance the effectiveness of sighting other aircraft, while visual conspicuity devices are designed to increase the chance of detection by attracting attention even when not being directly focused on.
The ATSB SafetyWatch highlights the broad safety concerns that come out of our investigation findings and from the occurrence data reported to us by industry. One of the safety concerns is Reducing the collision risk around non-towered airports.

This page gives several other examples of issues and accidents that have occurred around non-towered airports and provides guidance on how pilots can keep themselves and other pilots safe.
Acknowledgements
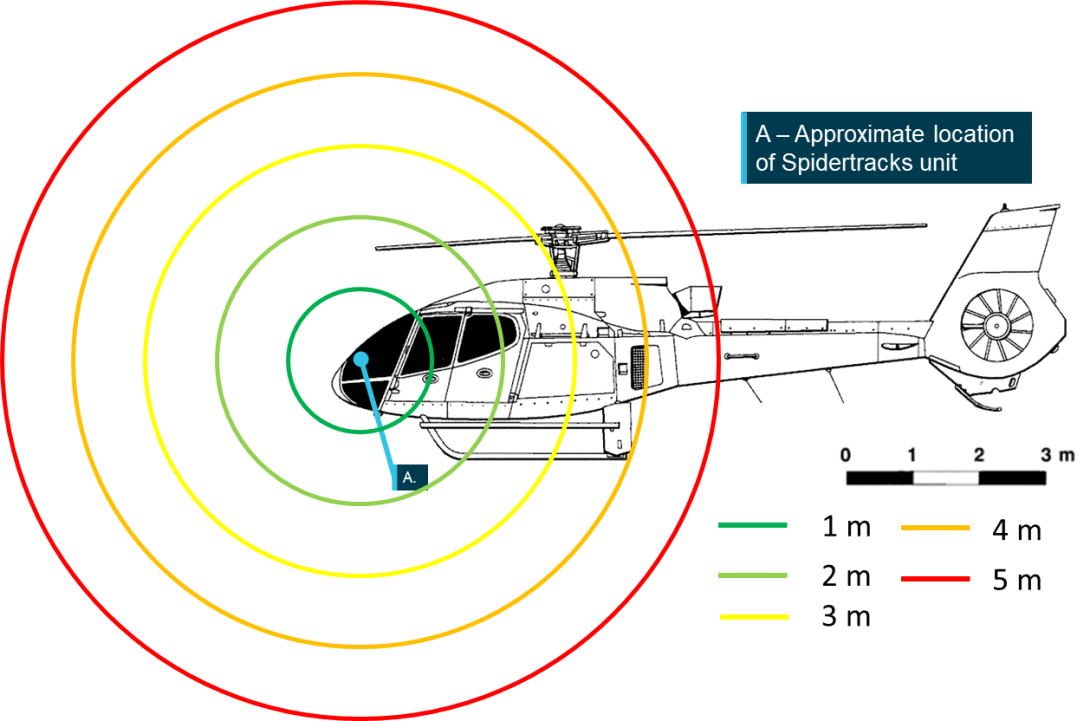
The ATSB acknowledges the assistance of iwiation GmbH, Airbus Helicopters, Sea World Helicopters, Spidertracks and the United States National Transportation Safety Board Office of Research and Engineering in the development and preparation of this study.
|
This safety study is presented in 4 sections: 1. Introduction 2. Background and Methodology – contains relevant contextual information related to the occurrence, technologies, processes used and other relevant supporting information. 3. Results and discussion – assesses and presents analysis of the ‘Background’ information 4. Conclusions. This study does not contain findings, however relevant conclusions and supporting information were considered as part of the safety analysis for AO-2023-001 and influenced relevant findings for that investigation. |
Introduction
This visibility study is intended to support ATSB investigation AO-2023-001, Midair collision involving Eurocopter EC130 B4, VH‑XH9, and Eurocopter EC130 B4,VH‑XKQ, Main Beach, Gold Coast, Queensland on 2 January 2023. It should be read in conjunction with, and in the context of, that report. It relies and expands upon factual information presented in that report.
Background
At 13:56:06, 2 January 2023, 2 EC130 B4 helicopters, VH‑XH9 (XH9) and VH‑XKQ (XKQ) operated by Sea World Helicopters collided mid-air over the Gold Coast Broadwater (Broadwater) adjacent to the Sea World theme park on the Gold Coast, Queensland.
Both aircraft were conducting 5-minute scenic flights; XH9 was on approach to pad 3 at the operator’s heliport, and XKQ had recently departed the operator’s park pad located 220 metres to the north of the heliport (Figure 1). Following the collision, XKQ collided with terrain and XH9 made an emergency landing. Four people were fatally injured with another 6 seriously injured.
Figure 1: Flight paths and locations
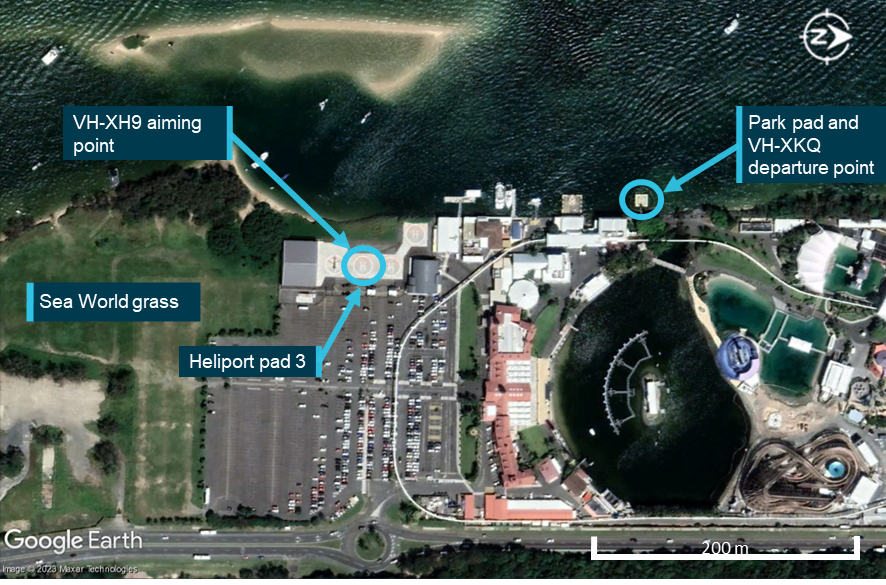
Source: Google Earth, annotated by the ATSB
The 2 aircraft were operating under Visual Flight Rules (VFR) in visual meteorological conditions (VMC) in non-controlled airspace. In non-controlled airspace, particularly in the vicinity of busy heliports, visual traffic acquisition and avoidance is a key part of a pilot’s defences in avoiding mid‑air collisions. Considering this, the investigation sought to determine whether ‘see-and-avoid’ could have been effective for the pilots and what effect the aircraft structure, pilot positioning and apparel, local environment and visual conspicuity equipment could have had on each pilot’s opportunity to visually acquire the other aircraft in time to initiate an avoiding manoeuvre. To allow for a detailed consideration of these elements and their effect on the development of the accident sequence, the ATSB established this separate safety study which was run in conjunction with the occurrence investigation.
The accident was recorded by a multitude of cameras around the accident site and onboard the aircraft capturing the lead-up to the accident and the accident sequence. This combined with flight path and aircraft orientation information recorded onboard the aircraft allowed for a detailed analysis of the relative positions and orientation of the 2 aircraft, the environmental conditions and the helicopters’ conspicuity.
The ATSB utilised techniques in aircraft position and cockpit visibility assessment developed by the United States National Transportation Safety Board and previously implemented in ATSB investigation AS-2022-001, Aircraft Performance and Cockpit visibility Study supporting AO-2020-012. This was combined with detailed video analysis performed by the ATSB, and video analysis and scenario reconstruction developed by specialists at iwiation GmbH (IWI) in Germany.[2] This was combined with information from a range of human factors literature, the ATSB’s wreckage analysis, the operator, the aircraft manufacturer, recording equipment manufacturers and the Civil Aviation Safety Authority to conduct this study.
Aim
The cockpit visibility study sought to understand the limitations and opportunity that the pilots of XH9 and XKQ had to visually detect and avoid other aircraft in the lead‑up to the collision. Concurrently with the study an animation was developed to demonstrate, as realistically as practical, the conditions that the pilots encountered.
Scope
This study considered visual detectability and conspicuity of the aircraft based on the limits of human performance and apparel worn by the pilots, aircraft structural obscuration (blind spots), and visual conspicuity devices fitted to the helicopters. This was completed using recorded position and orientation data from the aircraft, video recordings of the accident sequence and aircraft and human performance information.
The study did not specifically address the pilots’ mental models of the traffic environment or consider the potential benefits or limitations of electronic conspicuity devices or equipment such as aircraft collision avoidance systems including TCAS, ADS-B In or electronic flight bag applications with a traffic display. The investigation report addresses each of these elements in detail.
Methodology
The methodology for this study was based on the previous ATSB study AS-2022-001, with additional items considering the volume of recorded information that was available. The methodology included:
- A literature and document review looking at available information related to human visibility and perception characteristics, aircraft tracking devices and aircraft specifications.
- Verification of position and orientation information downloaded from the aircrafts’ Spidertracks units using onboard and external video footage.
- Development of to scale 3-dimensional models of the internal and external structures of representative aircraft using laser scanning technologies.
- Determination and verification of the design and pilot eye positions within each aircraft.
- Development of 2-dimensional representations of each pilot’s view of the aircraft structure. The other aircraft was positioned on this representation to determine when it would have been shielded from the pilot’s view.
- Based on the literature review and consultation with ATSB human factors specialists, human visual performance was considered to determine where the aircraft would likely appear to the other pilot, when they would likely have been able to detect it and how the acquisition opportunity could be improved through movement of the eye position.
- Finally, an animation was developed using position and orientation data showing the cockpit view for both pilots, demonstrating the effects of the limitations to visual acquisition.
Limitations
This analysis has been developed based on information and data from a wide range of sources, many of which were not designed for the detailed level of analysis that has been completed. Through the development of this study the ATSB, along with our international partners, has sought to cross reference and verify information wherever possible and practical using both onboard and external information sources. Where relevant and practical, summaries and results of these processes have been included. To accommodate for potential sources of error the ATSB has performed sensitivity analyses looking at the effect that certain changes would have had on results produced in this study.
Notes
- Throughout this report standard aviation units are used unless specifically stated. These units are nautical miles for distance, feet for altitude and knots (nautical miles per hour) for speed.
- All times in this report are referenced to Coordinated Universal Time (UTC). While the accident occurred in the Australian Eastern Standard Time (AEST) zone (UTC + 10 hours), key data was recorded in UTC which was retained for simplicity of the analysis. The collision occurred at 13:56:06 AEST corresponding to 03:56:06 UTC.
- Unless specifically stated otherwise, any reference to the ‘investigation report’ should be taken as referring to ATSB investigation report AO-2023-001.
Background and methodology
Aircraft information
As outlined in the Aircraft information section of the investigation report:
The Eurocopter EC130 B4 is a French-manufactured light utility helicopter developed from the earlier Eurocopter AS350 Écureuil (squirrel). It combined elements of the EC120 and the EC135 into the AS350 product line. The cabin was widened and lengthened, and an 11-blade shrouded Fenestron tail rotor replaced the conventional tail rotor of the AS350. The position of the pilot in command was moved from the front right in the AS350 (standard in most helicopters) to the front left in the EC130 B4.
The maximum all-up weight of the EC130 B4 was 2,427 kg. The single Safran (formerly Turbomeca) Arriel 2B1 turboshaft engine provided a take-off power output of 632 kW.
Both helicopters [VH‑XH9 and VH‑XKQ] were approved to be operated in the air transport[3] category and visual flight rules (VFR) Day meteorological conditions.
XH9 – visual conspicuity
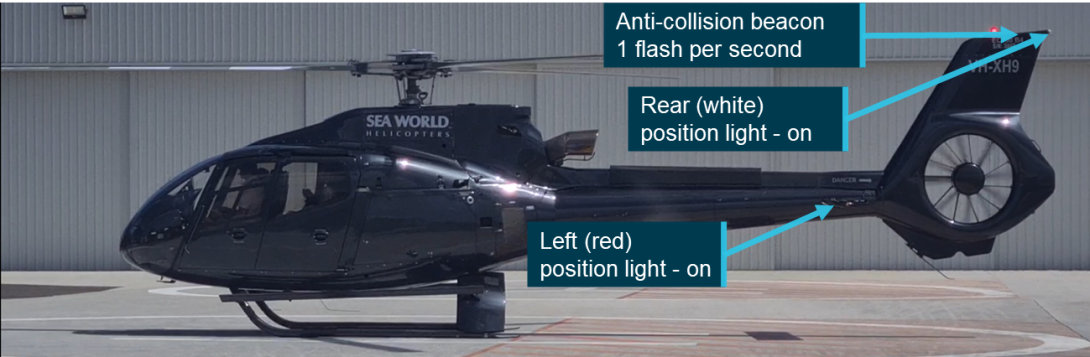
XH9 (S/N 3845) was fitted with lights and a rotor blade paint scheme to improve its visual conspicuity. It was fitted with left (red), right (green) and rear (white) position lights, an anti-collision beacon, landing and approach lights. XH9’s rotor blades were painted with a high‑visibility paint scheme in accordance with the aircraft maintenance manual specifications.
Lighting
XH9 utilised LED position lights, fitted to the centre of the outer edge of the horizontal stabilisers, maximising visible angle from the front of the aircraft. The aircraft was also fitted with a rear LED position light at the top rear of the aircraft’s vertical tail (Figure 2). The manufacturer was unable to confirm the actual power output of these lights, however they confirmed that they met the certification requirements under the United States federal aviation regulation (FAR) 27/29. The regulations defined the required output depending on the angle from which the light was viewed. The left and right position lights were required to have a minimum intensity of 40 cd[4] when looking from dead ahead to 10° from the centre line reducing to 5 cd between 20° and 110°. The rear position light was required to have a minimum intensity of 20 cd.
Figure 2: XH9 lighting configuration
Source: Witness video, annotated by the ATSB
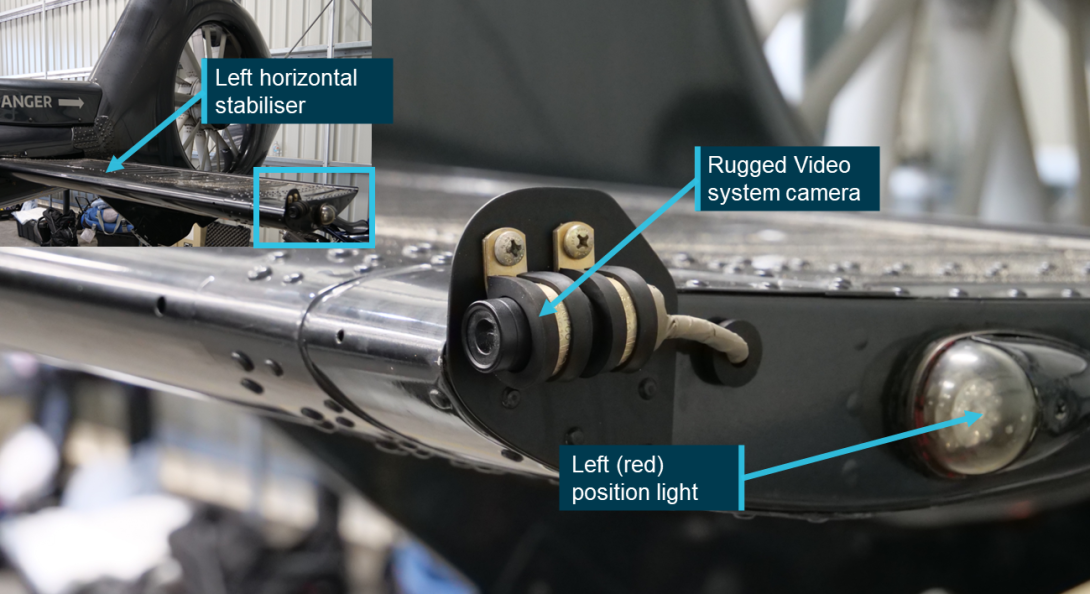
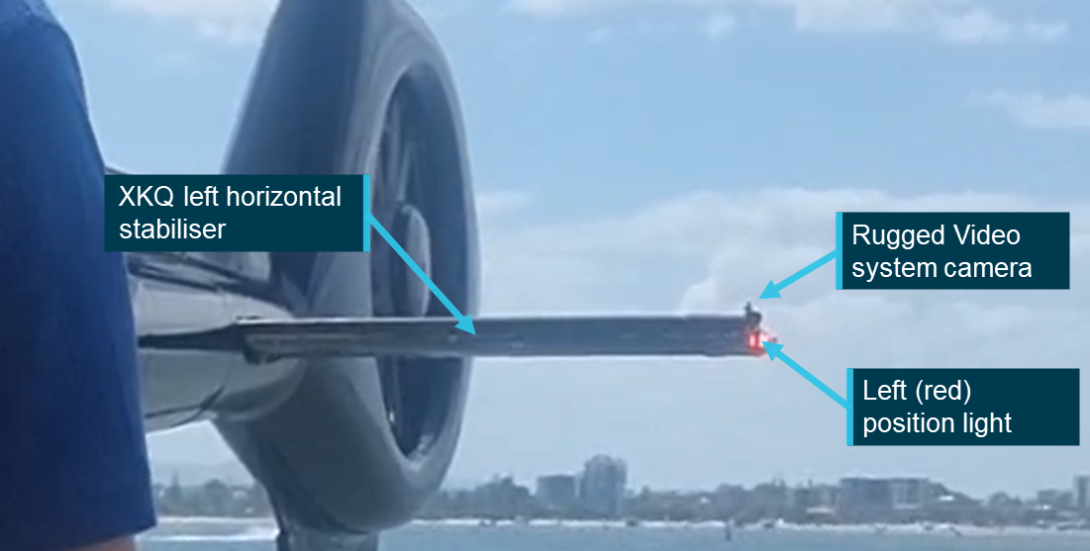
Forward of the left position light, on the outer edge of the horizontal stabiliser, was a small camera connected to the aircraft’s Rugged Video system (refer to the investigation report for further detail on this system) (Figure 3). The location of this camera reduced the visibility of the position light by impacting sight lines to the light from in front of the camera’s position. While there was a reduction in the visible arc, the position on the very forward edge of the stabiliser and above the centreline of the position light means that the impact is minimised. The wreckage examination determined that a camera was not fitted to the right horizontal stabiliser.
Figure 3: XH9 left horizontal stabiliser, Rugged Video system camera and left position light
Source: ATSB
XH9 was fitted with a single anti-collision beacon on the top of the aircraft’s vertical tail. The light consisted of a series of vertical LED strips around a cylindrical core, these LEDs illuminated simultaneously to give one flash per second. As with the position lights the manufacturer was unable to confirm the actual power of this light but confirmed that it met the requirements of FAR 27/29, which required a minimum intensity of 150 candela in line with the light’s horizontal plane. The required intensity reduced as the angle from the horizontal plane increased with a required minimum intensity of 15 candela between 20° and 30° above or below the horizontal plane.
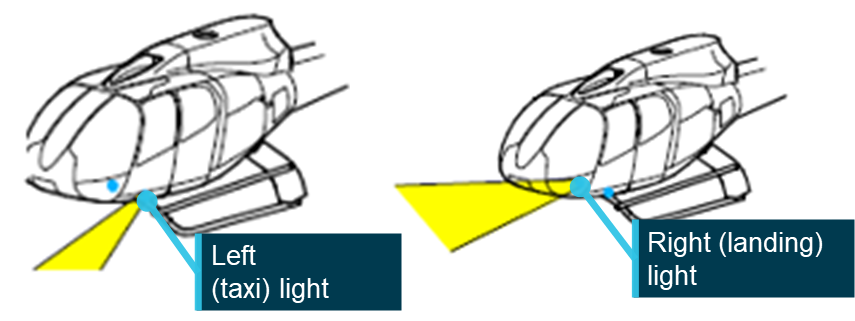
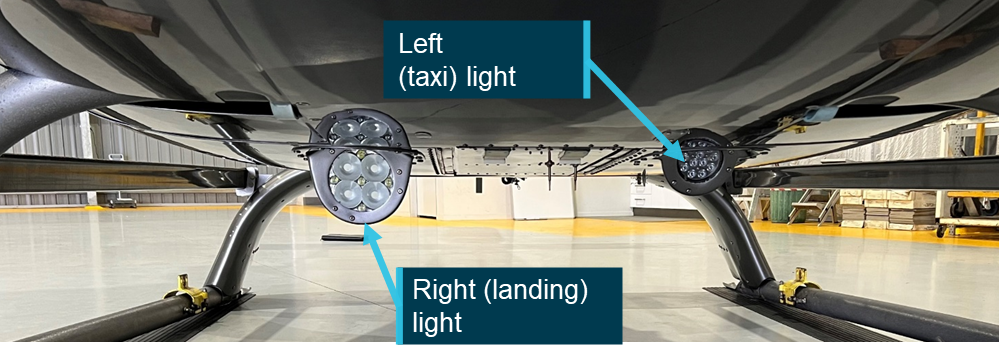
XH9 was fitted with a dual landing light system (see Figure 4), with one light on either side of the aircraft’s centreline, behind the forward landing gear connection point. The 2 lights serve different purposes (see Figure 4). The left or taxi light was designed for a wider beam and to be more vertically oriented for illuminating the area in front of the aircraft during taxi. The right light had a narrower beam, a shallower angle and a higher power rating allowing it to illuminate more of the landing area. The aircraft maintenance manual indicated that the lights were switched separately but activating either of them would illuminate the ‘LITE’ light on the instrument panel.
Figure 4: EC130 B4 – landing light configuration
Source: Airbus Helicopters, annotated by the ATSB
Figure 5: Landing light configuration on an exemplar aircraft
Note: This image is used to show configuration of the landing and approach lights. The type of light presented is not necessarily the same as that fitted to XH9 or XKQ. Source: ATSB
The left (taxi) location of VH‑XH9 was fitted with a Whelen P36P2T LED landing light. The light is rated to 15,000 cd at the centre of the beam and had a 40° beam spread. The light was recessed into a housing in the belly panel of the aircraft that directed the beam down at approximately 30° from the angle of the panel.
The right (landing) position was fitted with a GE 4681 halogen approach light. The light is rated to a max intensity of 310,000 cd at the centre of the beam with a horizontal beam spread of 15° and vertical spread of 9°. Maintenance documentation also indicated that this light had a retraction option which had not been installed. As with the landing light, the approach light was also recessed into a housing on the belly panel that directed the beam down at an angle of approximately 15° from the panel.
Imagery of the switch positions in the cockpit indicated that for the accident flight the landing and approach lights had not been switched on. Footage from a flight the previous day indicated that both lights were operational. A review of video footage from the accident flight indicated that XH9’s beacon and position lights were all operational (see Figure 2).
XH9 was not fitted with strobe lights, nor was it required to be.
Pulselite system
As outlined in the investigation report:
The Precise Flight Inc. Pulselite system was an approved solid-state electrical switching unit that pulsed existing external aircraft lights ‘to create an illusion of exaggerated motion’ intended to enhance recognition of the helicopter to other pilots. The Pulselite system is typically connected to the approach and landing lights however, other lights can be incorporated as desired.
XH9 had been fitted with the system in 2006 during its time in the United States and the control unit remained fitted to the aircraft. However, the switch to control the system had been removed, rendering it non‑functional. Further detail regarding the system and its operation can be found in the investigation report.
Rotor blades
The main rotor blades of VH‑XH9 were painted with a high‑visibility paint scheme which aimed to improve the aircraft’s conspicuity from above. The scheme consisted of 4 white sections painted over the standard grey blade colour. Figure 6 shows XH9 on the day of the accident being prepared for departure with the high‑visibility paint scheme shown on the top surface of the 3 blades. Once the blades were turning this paint scheme created the appearance of a series of concentric white circles, increasing its conspicuity from above.
Figure 6: XH9 showing high‑visibility rotor blade colour scheme
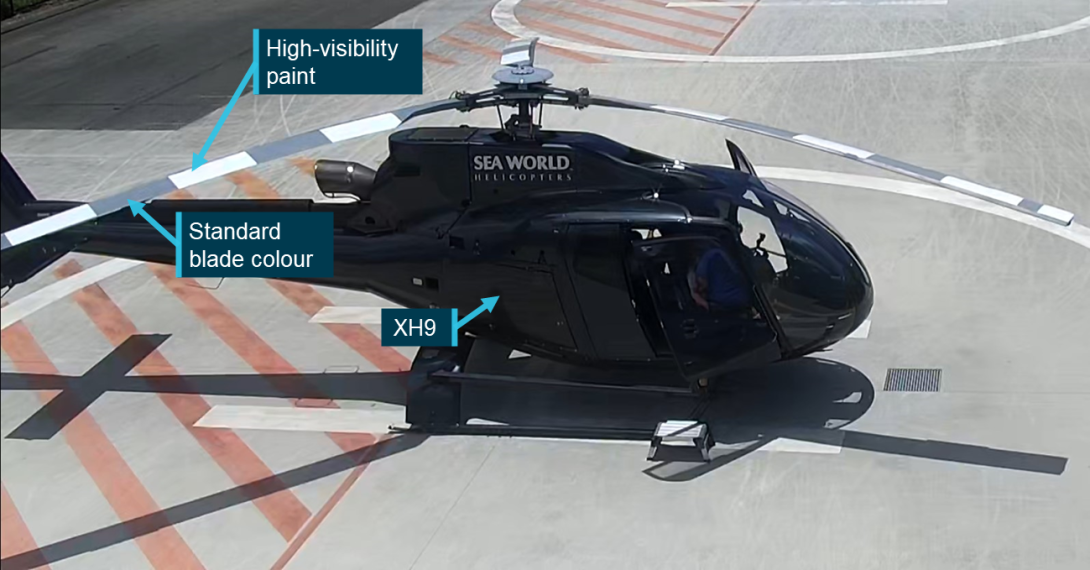
Source: Operator, annotated by the ATSB
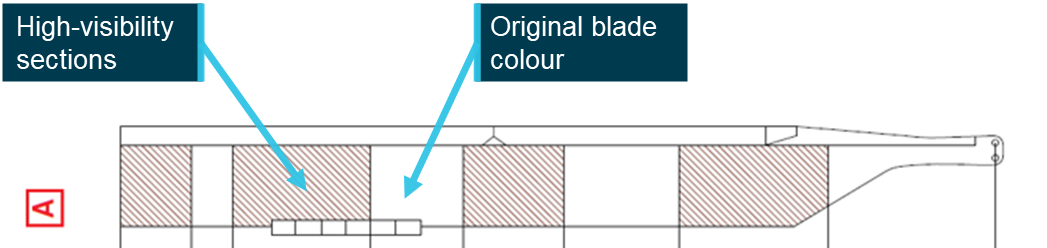
Maintenance documentation indicated there were 2 high‑visibility paint schemes (A and B) that could be applied to the EC130 B4 in 3 different colours (white, red, yellow); inspection of the blades indicated that the blades were painted in the ‘A’ scheme (see Figure 7).
Figure 7: Blade high‑visibility paint scheme A layout
Source: Airbus Helicopters, annotated by the ATSB
The undersides of XH9’s blades were not coated with high‑visibility paint to reduce the risk of flicker vertigo for the pilot.
Surface coatings
In previous maintenance activities both the left and right windshields of VH‑XH9 had been replaced under a supplemental type certificate (STC). Based on advice from the windscreen manufacturer it was determined that they were not tinted. This was supported by the footage available from inside the aircraft.
Review of the video footage and analysis of the wreckage indicated that the side windows of the aircraft carried a brown tint that was visible in images and video from onboard the aircraft.
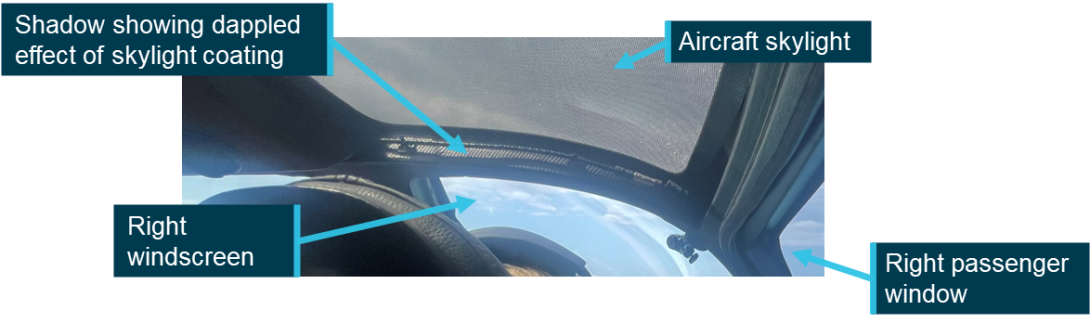
The footage also identified that the aircraft’s 2 skylights[5] had a surface coating applied to them. No record was identified in the available maintenance documentation of this modification. The imagery indicated that the skylight had been covered with a dappled[6] coating (see Figure 8).
This coating would have multiple impacts on the pilot’s visual acuity and acquisition. By introducing physical obstruction over the transparent surface, it would reduce the amount of glare that the pilot was experiencing through the skylight, but may impact both the perceived colour and/or luminance of a target. However, the physical obstruction may shield targets at distance, reducing opportunity to sight them. Finally, the coating may improve the likelihood of detection of a slow‑moving target providing a stationary reference across which the target will move.
Figure 8: XH9 skylight surface coating
Source: Supplied, annotated by the ATSB
Externally XH9 had gone through several different paint schemes throughout its career. At the time it was acquired by the operator and at the time of collision it was painted with a dark grey paint scheme with a lighter grey used for relevant markings and branding.
XKQ – visual conspicuity
XKQ (S/N 4639) was not fitted with high‑visibility rotor blades but had been retrofitted with side windows that had a tint applied. XKQ was fitted with lights intended to accentuate its visual conspicuity and increase the probability of it being seen by nearby pilots. It was fitted with left, right and rear (red, green and white) position lights, an LED anti-collision beacon and taxi and landing lights.
Lighting
Much of the lighting system in XKQ was the same as that fitted to XH9. XKQ was fitted with left (red), right (green) and rear (white) LED position lights and an LED anti-collision beacon. The manufacturer was unable to confirm the actual power output of these lights, but that they complied with the same regulatory requirements as the lights fitted to XH9. Records indicated that the left and right position lights XKQ had previously been fitted with were a combination LED and strobe light, however ATSB wreckage analysis identified that the strobe variant was no longer fitted.
As with XH9 the left position light of XKQ was partially obscured from ahead and above by the camera of the Rugged Video system.
XKQ was fitted with the same dual landing light configuration as XH9. Maintenance documentation indicated that the left (taxi) position was fitted with an LED landing light, however it did not identify the type or rated power of the light. The right (landing) position was fitted with a GE PAR46 aircraft light which was rated maximum beam candle power of 400,000 candela with a horizontal beam spread of 13° and a vertical beam spread of 14°. Review of video footage indicated that the aircraft’s approach light was on as the aircraft departed the park pad, the landing light was not visible in the footage and as the ‘LITE’ indicator inside the aircraft was active if either landing or approach light was on it was not able to be determined if the landing light was also active. As with XH9 these lights were recessed into housings on the belly panels of the aircraft which angled the beams down. Due to the disruption of the wreckage the angles were not able to be measured, however they appeared substantively like XH9.
XKQ was not fitted with strobe lights, nor was it required to be.
Figure 9: XKQ left horizontal stabiliser, Rugged Video system camera and left position light
Source: Supplied, annotated by the ATSB
Pulselite system
XKQ was fitted with a Pulselite system on 25 May 2009 during the helicopter’s time in New Zealand. The ATSB’s wreckage examination identified that the control unit and the relevant collective switch were present on the aircraft. The system was only connected to the aircraft’s landing and approach lights allowing them to pulse when the system was set to ‘PULSE’ and the landing and approach lights were switched off.
Witness video showed XKQ’s approach light was switched steady on rendering the Pulselite system inactive.
Rotor blades
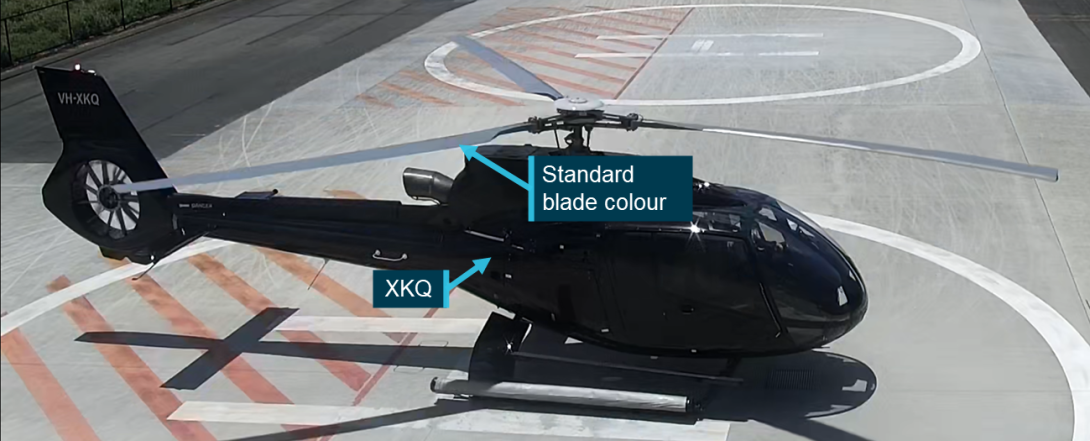
VH-XKQ’s rotor blades were not coated with a high‑visibility paint scheme, nor were they required to be. Figure 10 shows XKQ at the operator’s heliport prior to an earlier flight with the standard grey rotor blade colour visible.
Figure 10: XKQ at the operator’s heliport showing standard visibility blades
Source: Operator, annotated by the ATSB
Surface coatings
Review of the aircraft wreckage and onboard footage indicated that as with XH9, XKQ was fitted with non-original clear windscreens and brown tinted side windows. XKQ’s skylights were untinted and did not show fitment of the same dappled coating as XH9.
As with XH9, at the time it was acquired by the operator and at the time of collision, XKQ was painted with a dark grey paint scheme with a lighter grey used for relevant markings and branding.
Restraint information
XH9 restraints
All seats in XH9 were equipped with Pacific Scientific 4-point rotary buckle harnesses. These consisted of 2 over‑shoulder straps and 2 waist straps, one from each side. The 2 over‑shoulder straps were attached to an inertia reel fitted into the seat back. The inertia reel allowed the seat occupant to lean forwards during normal flight but would lock to restrain the occupant when subjected to a high loading, such as an impact.
Under normal flight conditions this restraint system will allow the pilot to move their torso and consequently, eye position forward and aft. The available movement will be determined by the position of the buckle on the torso, which is determined by the length of the waist straps. When secured in accordance with specifications, low on the hips, the inertia reels will allow the occupant full range of movement in an arc from the hips. While the positioning of the buckle on the torso of the pilot of XH9 could not be determined from available imagery, the inertia reel on the shoulder harnesses would have allowed the pilot to move their torso and head forward. The effect of the freedom of movement has been assessed in the Sensitivity analysis – eye position section of Cockpit visibility.
XKQ restraints
The restraints in XKQ were functionally the same as those in XH9. With the inertial reels allowing for movement of the seat’s occupant during normal flight but locking and restraining the occupant in the event of high loading.
Video footage from inside the aircraft prior to XKQ’s departure shows the pilot leaning forward and to the left demonstrating the movement envelope that these restraints provided under normal operational conditions.
Development of the 3-dimensional model
Overview
Discounting meteorological and human performance factors, which are considered separately, this study assumed that each aircraft would be visible from the other unless an opaque part of the aircraft’s structure was directly in line between, or shielding, the pilot’s eye position from the ’target’ aircraft.
To accurately determine the location of the aircraft’s structure from both pilots’ eye positions, over 3 days in February 2023 ATSB personnel visited the Sea World Helicopters facility on the Gold Coast and measured interior and exterior geometry of the third EC130 B4 in the operator’s fleet (registered VH-XKK) using a laser scanner. Subsequently, these measurements were used to build a full-scale digital model representing the aircraft’s external and internal structures.
General process
A FARO Focus series laser scanner was used to capture a series of 3-dimensional point clouds that define the internal and external geometry of the aircraft. Each point specifies the position coordinates of the material that reflects a laser beam put out by the scanner. As the scanner sweeps through 360° of azimuth and 150° of elevation it creates points representing the three‑dimensional location of the aircraft’s structure. Noting that the laser will only capture data when a reflection is received, transparent objects such as windows may not be identified or identified accurately. However, their position can be deduced from the surrounding structure.
As the scanner can only ‘see’ in a direct line of sight, a single scan cannot capture the whole aircraft as some areas will be in the scanner or aircraft’s shadow. To overcome this, a series of known points or ‘targets’ are set up around the aircraft and then the scanner placed in multiple locations where both the aircraft’s surfaces and the targets can be seen. The patterns created by the targets allow multiple scans to be combined or ‘merged’ by the scanner software.[7] The number of targets and their distribution simplifies the processing as it creates an identifiable pattern in the point cloud that the software can identify.
The ATSB utilised 2 different types of targets – spheres and checkerboards placed throughout the space at locations likely to be overlapped by multiple scans. The utilisation of spheres provided a target that maintains its shape when viewed from any angle so can be referenced in any scan where it is visible. Checkerboards are used as they are easy to transport and position in larger numbers, however flat surfaces mean that they are only usable when the scanner can capture the whole checkerboard.
In more complex areas such as the cockpit, the single position of the Focus series scanner can be limiting as there will be many items, such as the seats and control console casting shadow between the scanner and the aircraft structure. This means that solely using the Focus series scanner, some areas may be missed, or an impractically large number of scans are required to capture the whole structure.
For the cockpit area, to supplement the data captured by the Focus scanner the ATSB employed a FARO Freestyle 2 series hand scanner. The hand scanner allows the operator to access and scan harder to reach areas within the structure and as it does not scan from an individual location it can capture all around objects which would have otherwise required multiple scans from multiple different angles to effectively capture the structure. These scans captured with the Freestyle 2 can then be processed separately into a different model or, provided that sufficient of the checkerboard and sphere targets are captured, combined with the Focus scans to improve coverage and resolution in difficult to access areas.
Once merged, the scans generate a point cloud (see Figure 11) and are processed into a triangulated mesh. Both the cloud and the mesh are dimensionally accurate representations of the whole aircraft.
The point cloud that was generated by the scanner contained all the points that the scanner had been able to see. This included not only the aircraft but the surrounding environment and the hangar. Additionally, depending on the nature of the material that the laser was reflecting from, there was some ‘noise’ or spurious points in the scan. To correct this the scan data was automatically and then manually ‘cleansed’ by removing these points from the point cloud.
VH-XKK
Both XH9 and XKQ were EC130 B4s with the same forward airframe and cockpit configuration. This allowed them to be represented by a single aircraft model. Twenty Focus scans were captured, 18 of them external to the aircraft and 2 internal capturing the basic structure. These were then supported by a series of 6 internal scans captured with the Freestyle 2 scanner. Two of these scans focused on the cockpit structure with no personnel in the aircraft. Two scanned the cockpit with an exemplar person in the pilot’s seat and 2 were undertaken with personnel in the passengers’ seats to the pilot’s right.
Passengers
Review of the passenger manifests provided by the operator and the video footage from onboard the aircraft determined that while both aircraft were single pilot operations, passengers were in the seats to the pilots’ right and would have partially obscured the pilots’ views to the right. Even with the passenger video that provided evidence that the passengers were secured within their harnesses throughout the flight it is not possible to determine their exact positions and the extent to which they may have obstructed pilots’ views. To assess what effect a seated passenger may have had, the ATSB developed 2 models of the aircraft, the first without passengers and the second with passengers located in the 2 seats to the right of the pilots. Following initial assessment of the relative location of XH9 from XKQ it was determined that the passengers’ positioning was unlikely to have impacted the detectability of the approaching aircraft and the model without passengers was used for further analysis.
Rotor blades
At the time of scanning, VH-XKK was not fitted with main rotor blades due to ongoing maintenance activities. The ATSB assessed this was the preferred way to model the aircraft as the profile of the blades when the aircraft was on the ground would not have been representative of their location in flight. From the internal passenger videos, it can be clearly seen that while the rotor disc is discernible, due to the rotational speed it did not have a significant impact on the detectability of the approaching aircraft.
Landing gear
VH-XKK was modelled sitting on the ground with weight resting on the skids resulting in slight splay of the skids to support the weight, when the aircraft lifts off and the weight is taken by the rotor system this splay will come off and the landing gear position will change slightly. Due to the position of the skids below and behind the pilot, this will not influence the visibility from or detectability of the aircraft. To limit any effect this may have had on the manipulation of the model in its development (see Point cloud conversion) wherever practical other parts of the aircraft were used for scaling and rotation of the model.
Mod-074581
Any modification affecting the basic dimensions of the aircraft (length, width or height) must be considered when preparing and converting the point cloud. The EC130 B4 aircraft maintenance manual (AMM) identifies 2 length dimensions for the EC130 B4 (10.60 m or 10.81 m) depending on whether an aircraft is pre‑ or post‑mod 074581. Mod 074581 was introduced by Airbus Helicopters to strengthen the connection between the fenestron tail rotor and the tail boom after cracking in the area was identified. ATSB review of the maintenance records identified that VH‑XH9 was post‑modification, while VH‑XKQ was pre‑modification. The Airworthiness Directive (AD) that mandated the modification required that it be introduced to all relevant helicopters by 11 January 2024, but that any helicopter without the modification required inspection every 25hrs until it was completed. As of end of operations on 1 January 2023, XKQ had a further 15 hours until the next inspection was required.
ATSB review of VH-XKK when conducting scanning operations determined that it was a post‑mod 074581 aircraft. This does not affect the ability of the model to be used to replicate the cockpit environment and visibility of VH‑XKQ as the dimensions of the cockpit and the bulk of the body and tail boom of the aircraft, up to the connection between the boom and the fenestron, remain the same.
Figure 11: 3D point cloud model of VH-XKK
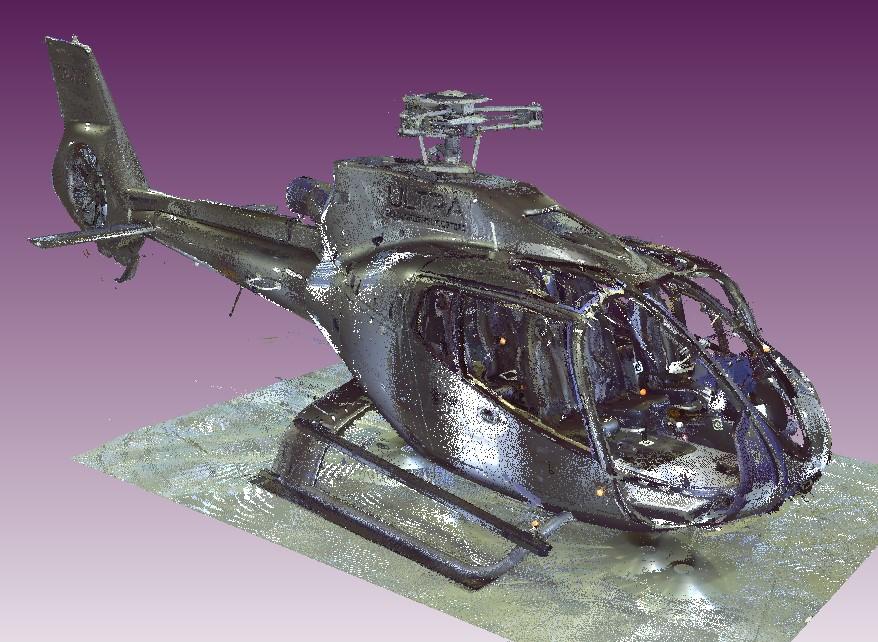
Source: ATSB
Creating a 2D representation of the pilot’s view
To create a 2D representation of the pilot’s view the position of their eye relative to the aircraft around it must be known. From this the azimuth and elevation angles from the pilot’s eye to elements of the cockpit structure can be located and plotted on an equirectangular[8] 2-dimensional chart. This chart represents a spherical view of the aircraft around the pilot’s eye position over which the location of the target aircraft can then be plotted.
Locating the design eye position
The ATSB obtained the design eye position (DEP) from the aircraft manufacturer (see Figure 12). The DEP is the location from which the manufacturer intends for a 50th percentile pilot to operate the aircraft and view the cockpit. The manufacturer defined this position in millimetres (X = 2,376, Y = 330, Z = −1605) in a coordinate system with an unknown origin point. All the ATSB calculations and measurements used dimensions and locations defined in the AMM. To convert between the coordinate system that the DEP was in and the AMM coordinate system a common point needed to be defined.
It was identified, as shown in Figure 12, that the manufacturer had also identified the X and Z values for the transition point between the base and back of the pilot’s seat in the diagram which showed the coordinates of the DEP. A Y value was obtained by assuming the transition point and the pilot’s eye position would be centred on the seat. The 3D offset between the DEP point and the seat transition point was then calculated.
To convert the DEP to the AMM coordinate systems, the ATSB identified the 3D coordinates of transition point between the base and back of the seat within AMM and applied the offset as calculated from the DEP coordinate system to locate the DEP within the AMM coordinate system.
Figure 12: Manufacturer provided coordinates for the DEP for EC130 B4
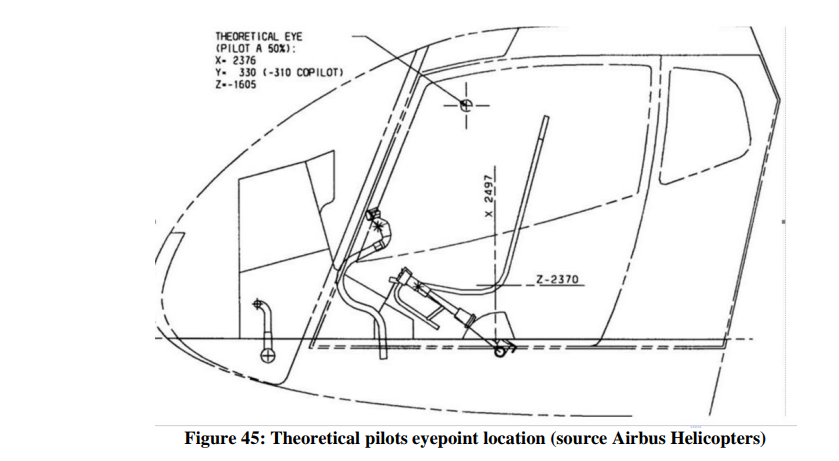
Source Airbus Helicopters
Point cloud conversion
All points in the 3-dimensional model were recorded relative to an origin point. In the case of the aircraft scans, the origin was the location of the scanner head when the first scan was taken. These coordinates are referred to as being in the Scanner Axis System.
To calculate the position of the target aircraft relative to the viewer aircraft the target’s 3‑dimensional position in the viewer aircraft’s coordinate system must be known. For this analysis the viewer aircraft’s coordinate system is taken to be as the Body Axis System (BAS) defined by the AMM. Points in the 3-dimensional model are converted from the Scanner Axis System to the BAS using a series of matrix transformations.[9]
Defining the proper rotation and translation matrices required the identification of several 3‑dimensional points in the Scanner Axis System with known coordinates in the BAS. For this study the ATSB used the rear tips of the left and right horizontal stabilisers, the nose and rear of the aircraft and the top of the rotor head as identified on the aircraft 3‑view diagram (Figure 13). These points were identified in both the Scanner Axis System and in the aircraft’s BAS.
Once the transformation matrices were defined the ATSB transformed each point in the point cloud from the Scanner Axis System into the BAS. A conversion of the DEP is not required as it has already been calculated in the coordinates of the BAS.
With the aircraft fuselage and DEP both located within the BAS, the azimuth and elevation angles of points representing the aircraft structure from the DEP were trigonometrically calculated and plotted on an equirectangular plot (see Figure 14). This chart will be combined in the Results and Discussion section with the relative positions of the target aircraft to determine when the target aircraft would have been shielded from the DEP.
Figure 13: 3-view diagram identifying relevant points of comparison
Source: Airbus helicopters, annotated by the ATSB
Figure 14: Cleaned equirectangular view from the design eye position

Source: ATSB
Pilot information
The details regarding each pilot’s experience, training and other factors can be found in the investigation report. This study will consider 2 aspects of the pilots that can impact the scope of their fields of view: the pilots’ eye positions (considered in Pilot eye positionbelow), and the effect of headwear each pilot wore during the accident flight.
There are 2 elements of headwear that will be considered as part of this analysis – sunglasses and hats.
Sunglasses
In their guidance material Sunglasses for Pilots: Beyond the Image the United States Federal Aviation Administration (FAA) defines the key benefits of sunglasses while operating aircraft:
Sunglasses reduce the effects of harsh sunlight, decrease eye fatigue, and protect ocular tissues from exposure to harmful solar radiation. Additionally, they protect the pilot’s eyes from impact with objects (i.e., flying debris from a bird strike, sudden decompression, or aerobatic maneuvers). Sunglasses can also aid the dark adaptation process, which is delayed by prolonged exposure to bright sunlight.
It is important to note that sunglasses will only provide the benefits stated when they are fitted with the appropriate lenses with relevant impact resistance and tinting characteristics.
Polarisation is a process used on sunglasses allowing them to further reduce glare and eyestrain by blocking reflected light from surfaces such as water or snow. However, this can interfere with visibility of instruments in the cockpit with anti-glare coatings, enhance striations when looking through windscreen materials and mask light reflections from aircraft that may improve visual detection opportunity. There may be further impact on the visibility if sunglasses are worn in an aircraft that is fitted with tinted windscreens or windows as the interaction of the 2 coatings may further mask light reflections or impact the contrast ratio between an object and its background. (FAA Civil Aerospace Medical Institute, 2015)
It is also important to note that where frames of these sunglasses do not wrap around the head, the frames can shield areas of the outer field of view (FOV). Depending on the shape and thickness of the frames this can potentially obscure threats such as birds or other aircraft.
XH9
The pilot of XH9 wore a pair of sunglasses during the accident flight. These sunglasses were fitted with prescription lenses that were required to be worn when exercising the privileges of their pilot licence. These glasses were ‘aviator’ style, meaning that they sat flat across the pilot’s face, not wrapping around the head at the sides. While effective, this style of glasses can allow for visible and UV light to pass around the frames, increasing the amount of glare and eyestrain that a pilot may experience, possibly reducing visual acquisition opportunity.
XKQ
The pilot of XKQ also wore a pair of sunglasses during the accident flight. They were recovered from the accident site by the Queensland Police Service. Manufactured by Versace, these glasses were also ‘aviator’ style and were fitted with impact resistant polarised lenses. As discussed above, the limitation of polarised lenses is that they can interfere with the pilot’s ability to read certain instruments and reduce the detectability of outside objects.
Hat
Wearing a hat limits the direct impact of sunlight shading the eyes or skin. A hat with a broad, 360° brim which shields the eyes and skin all around the head. While providing shade the hat brim will block the visual field above the hat brim. For aviation operations the use of a hat with a 360° brim can be impractical as the rear of the brim will force the pilots head to sit off the headrest (defeating the protective purposes of the headrest) and altering the eye position. In addition, a 360° brim can hinder or prevent the use of over-ear headsets. Alternatively wearing a cap, having only a brim at the front, (its peak), shades over the eyes while eliminating the issues with a 360° brim. Further, the peak may be curved allowing it to be higher in the centre and lower on the edges, reducing the shielding of the wearer’s visual field.
XH9
Video footage from inside XH9 identified that the pilot was not wearing a hat.
XKQ
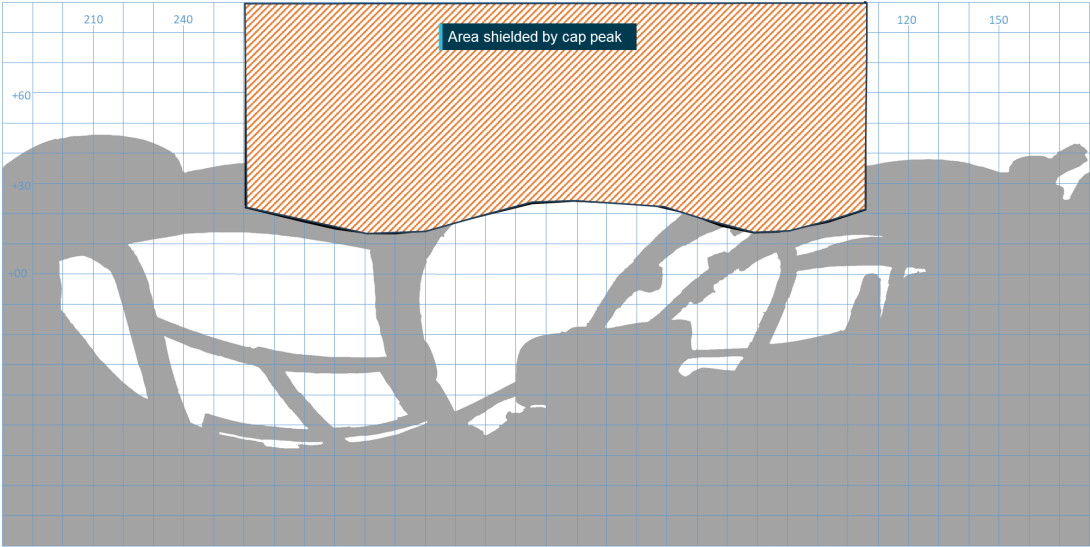
The pilot of XKQ was wearing a Sea World Helicopters cap for the accident flight. This cap was a ‘trucker’ style, with a solid front panel embroidered with the Sea World Helicopters logo and the remaining panels were of mesh construction. While onsite conducting 3D modelling in support of this study ATSB personnel examined an exemplar Sea World Helicopters cap and photographs, 3D scans and measurements of it to help determine its potential impacts on the pilot’s FOV. The exemplar cap had an approximate peak width of 130 mm, height of 40 mm and depth of 80 mm at the centre. It is important to note that the peak of the cap is manipulable and so the impact of the peak of the pilot’s actual cap may have differed slightly from the exemplar.
The cap’s peak extended at a slight downward angle from the cap’s body so that the front of the peak sat lower than the body of the cap. To assess how this would impact the pilot’s FOV, the ATSB placed the cap over the lens of a spherical camera to simulate the position of the cap relative to the pilot’s eyes and captured an image from the simulated position. Based on this image, the area of the FOV from the pilot’s eye position that would be obscured by the cap’s peak was determined (see Figure 15). A pilot wearing the cap would have been able to see objects in this area. The area where the cap’s peak obscured the pilot’s FOV was verified by identifying the boundaries of the FOV of an ATSB investigator of the approximate height of XKQ’s pilot seated in the left seat of the helicopter while wearing the cap.
Figure 15: Equirectangular view of the cockpit from the pilot’s eye position showing the area of visibility impacted by the pilot’s cap brim
Source: ATSB
Pilot statement
XH9
The pilot of XH9 provided a range of detailed information to the ATSB supporting the investigation, as presented in relevant sections of the investigation report. For the purposes of the visibility study there were 4 primary pieces of information that were relevant to this work.
- The pilot was aware of XKQ sitting on the park pad as XH9 transited down the Broadwater towards the operator’s heliport, sighting it on the pad with the doors closed.
- As XH9 transited past XKQ sitting on the pad, XH9’s pilot assessed that the aircraft would pass behind them on their approach and did not pose a threat.
- XH9’s pilot assessed that if XKQ departed, its pilot would make a radio call identifying that fact which would alert them (pilot of XH9) to the changed threat status of XKQ and the need to direct more attention to that aircraft. They reported that no such call was heard.
- XH9’s pilot had identified a black vessel that was operating in proximity to the approach path that they planned to pass behind.
This study has been developed on the assumption that the pilot of XH9 needed to identify the change in status of XKQ at or after the time it lifted from the park pad without a radio call or other alert.
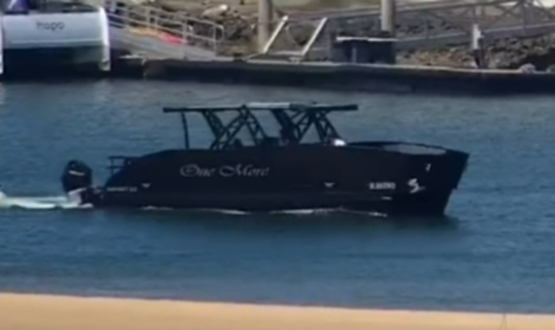
Vessel
XH9’s pilot stated that the vessel (Figure 16) required their attention; the ATSB sought to determine where it, and XKQ would have appeared in their FOV. The ATSB triangulated the position of the vessel at a series of points based on timestamp corrected frames of video recordings. The position of the boat between these points was interpolated assuming an approximately constant speed. The path of the boat was then simulated and verified using the video recordings.
Due to the limitations of the number and locations of the cameras used to the triangulate the position the vessel was only tracked between 03:55:44 and 03:56:17 (22 seconds before through 11 seconds after the collision). The track of the vessel was continued past the collision time to align with the video footage that had been used to identify its location.
The relative location of the vessel to the pilot of XH9 was then calculated and plotted. This involved the same process used to calculate the relative location between the 2 aircraft in the lead‑up to the collision.
Figure 16: Vessel being analysed
Source: Supplied
Recorded data
Spidertracks
To accurately calculate the position of each aircraft relative to the other pilot’s FOV both aircrafts’ positions and orientation (pitch, roll and heading) parameters were required. As outlined in the investigation report, these parameters were extracted from the Spidertracks SpiderX units of both aircraft.
The 1-second attitude heading reference system[10] (AHRS) data was used for initial definition of the flight paths and aircraft orientation parameters. In support of further analysis for XH9 the ATSB also obtained and assessed the sensor outputs from which the AHRS data is calculated using a Kalman filter.[11] Further detail regarding the recovery of information from the Spidertracks units from XH9 and XKQ can be found in the investigation report.
Spidertracks AHRS data records altitude in metres relative to the WGS84 ellipsoidal model of the earth, this model over-estimates values for altitude on the Gold Coast by approximately 40 m. To account for this, a −40 m correction was applied to all altitude values for both aircraft before further analysis was completed.
Position error
Spidertracks units are not certified aviation position reporting devices, and they are not required to meet any performance or accuracy standard.
Along with the position and orientation information, the SpiderX units also record the horizontal and vertical positional accuracy and positional dilution of precision[12] (PDOP) parameters. Horizontal and vertical accuracy is reported in metres and PDOP is reported as a dimensionless parameter. The higher its value, the less confidence there is that the accuracy reported is correct. There is no standard interpretation for PDOP coefficients, however they can be generally characterised as per Figure 17. Spidertracks advised that data with PDOP values exceeding 25 or accuracy values exceeding 100 m will be treated as invalid by the system.
Figure 17: Interpretation of DOP values
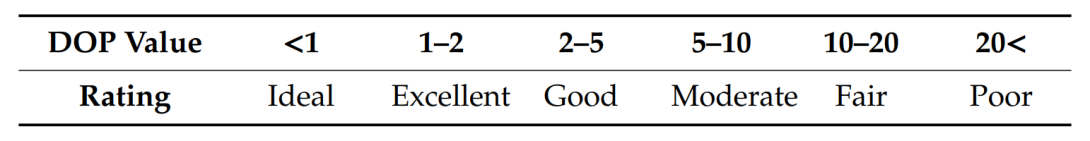
Source: (Isik, Hong, Petrunin, & Tsourdos, 2020)
Between 03:51:40 and 03:56:06, from the time XH9 departed the heliport until the collision, XH9’s SpiderX unit reported a constant horizontal and vertical accuracies of 2 and 3 metres respectively and a PDOP value varied between 1.01 and 1.59 averaging 1.11.
Between 03:55:40 and 03:56:06, from shortly before XKQ departed the park pad until the collision, XKQ’s SpiderX unit reported a constant horizontal accuracy of 3 metres and a vertical accuracy of 5 metres improving to 4 metres after 03:56:02. The PDOP value varied between 1.12 and 1.38 averaging 1.25.
These values indicate a high accuracy and confidence in the position being reported.
Figure 18 diagrammatically represents the accuracy margins as reported by the Spidertracks unit from a left side view of the aircraft.
Figure 18: Approximate GPS error diagram
Source: Airbus Helicopters, modified and annotated by the ATSB
Video footage
As outlined in the investigation report, multiple sources of video footage of the flight, collision and the response and recovery efforts were available to assist the investigation and this study. The study used video footage from onboard both aircraft, fixed CCTV cameras on both sides of the Broadwater, and from witnesses around the accident site. This footage was used to verify aircraft configuration, assess the accuracy of other recorded data, locate and assess positions of watercraft and review the position of the pilots within the aircraft.
Data verification
The ATSB, in conjunction with IWI, did several things to verify the aircrafts’ recorded positions and orientation parameters. The ATSB provided IWI with the recorded data and relevant onboard and external video footage. Using this information IWI generated an initial animation of the position and orientation of the aircraft within a simulated environment. To ensure consistency between the animation and the video footage, the view of the animation from the position of the cameras used to develop it was required. The position and orientation of the video cameras within the animation environment were estimated using common features (such as buildings or aircraft structure) and relevant meta data such as time, position and orientation.
By viewing the video footage and the corresponding view of the animation simultaneously and tracking common points between them, differences could be identified. The ATSB attempted to resolve any differences by conducting additional review and analysis of the recorded data and available imagery. Where the cause of a difference was identified, corrections were made accordingly. Where there was insufficient information to determine the cause of a difference and correct the data deterministically the animation was updated with estimates of relevant parameters. This process was then repeated as necessary to minimise the difference between the video footage and the animation.
Limitations
The following sources of potential error were considered when completing the data verification process.
- Error in the estimates of the position, orientation and movement of the various cameras used for the verification.
- Error introduced by internal parameters of the camera including lens distortion and rolling shutter effect.
- Error in the sub second alignment between the recorded data and the video footage. Data is reported at 1 Hz and interpolated to give a constant trajectory, video footage is recorded at various frame rates depending on the camera, leading to a potential misalignment.
- Errors, inaccuracies and incompleteness in the simulated external environment and external points used for verification.
These potential sources of error do not invalidate either the verification or further analysis, however they do introduce potential for variation (uncertainty). To account for this uncertainty and other factors, the ATSB completed a sensitivity analysis on the results that the study produced.
Onboard footage
Passengers on board both XH9 and XKQ recorded a range of video footage throughout the accident flights using hand-held electronic devices. For this study the ATSB reviewed these videos looking specifically at indications of the location and orientation of the pilot’s head and resulting eye position, the location and environmental surroundings of the approaching aircraft and the presence and use of visual conspicuity devices.
XH9
Video footage was recorded by 2 rear seat passengers on board XH9 during the final 30 seconds of the flight. The footage captured by the left rear passenger showed XKQ and the background it was traversing across from the time it departed the pad until the collision. It did not provide any information regarding XH9’s pilot’s head but it did show the right (green) position light on XKQ was operational.
The second video was taken from the rear right passenger aboard XH9. It captured 23 seconds of footage leading up to the collision panning from the right of the aircraft and through the cabin. XKQ appeared in this footage for about 3 seconds (between 13 and 10 seconds before the collision) showing the aircraft climbing out of the park pad and moving towards the accident location.
This footage showed the location and orientation of XH9’s pilot’s head for the final 12 seconds before the collision. The footage initially shows the pilot looking straight ahead. Approximately 8 seconds before the collision the pilot appears to look slightly down and to the left for 2 seconds before looking straight ahead again. Five seconds before the collision the pilot rotates their head to the right for approximately 3 seconds before recentering. At this point, 2 seconds before the collision, the pilot again looks right in response to a passenger interaction.
This footage, along with other video and still images taken earlier in the flight, was used to identify the presence of a surface coating on XH9’s skylights.
XKQ
Footage was recorded by 4 passengers on board XKQ. For the purposes of this study the footage reviewed was limited to the 24 seconds between when XKQ departed the park pad and the collision. The only footage of the XKQ’s pilot captured during this time was from the rear of the aircraft. The footage pans across the aircraft showing the pilot twice. The pilot is first shown 16 seconds before the collision looking straight ahead. The pilot is shown again approximately 12 seconds before the collision, appearing to look slightly down and to the right.
Footage from 2 of the cameras also captured the approach of XH9. Footage from a front passenger captures XH9 for 2 seconds, between 12 and 10 seconds before the collision. Footage from a rear passenger captures XH9 for 4 seconds between 7 and 2 seconds before the collision. This footage was used to verify that XH9’s tail beacon was working and determine the visibility of other aircraft lights prior to the collision. These videos were also used to assess the contrast of the background against which XH9 would have appeared.
Locating the target aircraft
The location of the target aircraft in the field of view of the pilot of the viewer aircraft can be defined in terms of the azimuth and elevation angles from the viewer to the target, as depicted in Figure 19. To compute these angles, the relative position of the 2 aircraft in 3-dimensions must be defined. The target aircraft’s coordinates are first transformed from an Earth-based coordinate system into the viewer aircraft’s BAS. The azimuth and elevation angles from the viewer aircraft to the target can be computer trigonometrically.
The azimuth and elevation angles to the target aircraft are then plotted over the equirectangular plot of the azimuth and elevation angles of the viewer aircraft’s structure (as seen from the DEP), as presented in the section titled Point cloud conversion. At points where the azimuth and elevation coordinates of the target aircraft overlap those of the viewer aircraft’s structure, the target can be considered to be obscured or ‘shielded’ from the pilot of the viewer aircraft. The same process is applied to determine the location and shielding of the sun from the viewer pilot’s DEP.
Figure 19: Azimuth and elevation angles from viewer aircraft to target aircraft
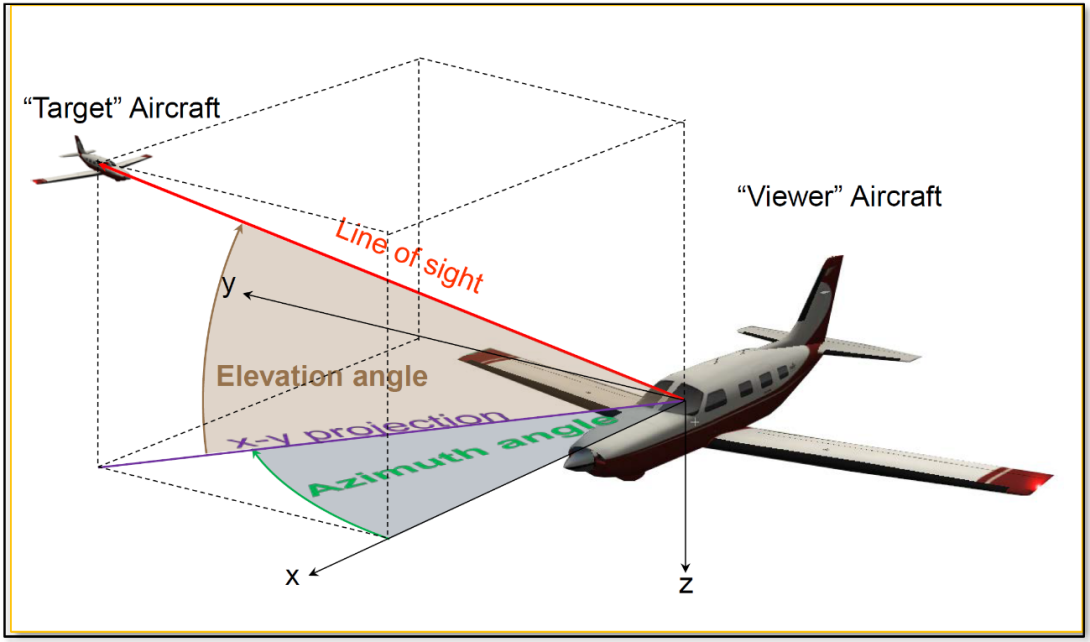
Source: NTSB
Meteorological information
Wind information
As outlined in the investigation report, weather reports for the day indicated that there was a moderate south-easterly wind at around 15 kts with gusts up to 25 kts. These reports were verified with onboard and external photographs and videos showing the sea state, which indicated winds of 11 to 16 kt and the windsock at the park pad showing approximately 12 kts as XKQ departed.
Cloud information
Weather reports, video footage and supplied photographs identified scattered cloud over land at around 3,500 ft. At this level the cloud would not have been a direct factor in the visibility of either aircraft operating at or below 500 ft. However, shading produced by the cloud and changes to luminance characteristics of the background as an aircraft passed in front of a clouded area could have impacted the aircrafts’ detectability to the viewer. For example, a dark coloured aircraft will likely be easier to detect against a white cloud than against a dark cloud.
Sun position
Where the sun is visible, or close to the edge of the field of view, its glare can reduce a pilot’s ability to locate traffic. The ATSB obtained data on the sun’s position relative to the aircraft flight paths and the collision location from the Geoscience Australia sun and moon position calculator.[13] These positions within the pilots FOV will be presented in the Environment section of Aircraft conspicuity and detectability.
Background luminance
Background luminance[14] is the effective brightness of the background against which an object is being perceived. During the day, the background luminance depends on the sun intensity which is affected by the time of year, location and other atmospheric conditions including cloud or smoke haze. The actual background luminance on the day of the accident was unable to be determined. Table 1 reproduced in Hobbs (1991) from the Illuminating Engineering Society’s (IES) Lighting Handbook provided approximate values for luminance in common conditions. Based on the time of year (mid-summer), time of day (middle of the day), location (southern Queensland), and the limited cloud cover, all supported by witness imagery and video footage, it was assumed that the background luminance was likely best estimated by 3,000 cd/m2 which the IES identifies as a clear day. This was then used for further assessment.
Table 1: Luminance of common backgrounds
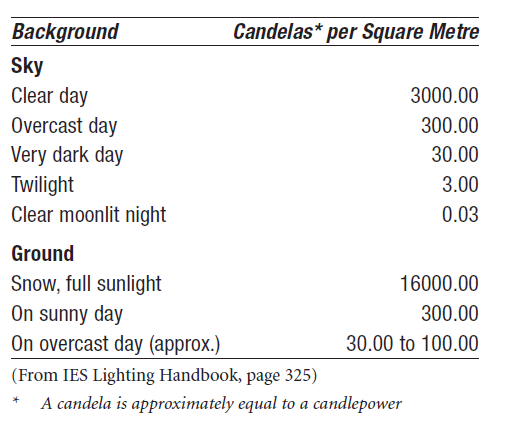
Source: IES Handbook in ATSB – Hobbs 1991
Human performance information
Object perception
It is not possible to state how large an object needs to be in a person’s field of view before they are able to distinguish it. This is due to a wide variety of factors both internal and external to the viewer and include the background that an object is seen against, where in the field of view it appears, relative motion of the object, vibration and physiological factors such as fatigue, age and hypoxic effects.
Multiple studies and reports give varying values as to what the minimum perceptible size of an aircraft may be. An NTSB report from a mid-air collision in 1987 (NTSB, 1988), suggested that the largest dimension of the aircraft must span a visual angle[15] greater that 12 minutes of arc (0.2°). Other examples suggest between 24−36 minutes of arc (0.4−0.6°) is more realistic, especially if conditions are sub optimal (Hobbs, 2004). The 3 main factors that will affect the size of the aircraft in the pilot’s eye are the dimensions of the aircraft, its relative orientation and distance from the viewer.
When viewed from head-on, a helicopter’s largest angular dimension will be determined by either the height or width of the fuselage depending on which is larger. If the viewer is perpendicular to the direction of travel the full length of the helicopter will be presented, giving a much larger visual angle spanned. For example, the EC130 has a fuselage width of approximately 2.2 m, height[16] of approximately 1.9 m and a length of approximately 10.8 m.[17] At 200 m these dimensions span visual angles of 0.63°, 0.54° and 3.06° respectively. Depending on the orientation of the aircraft different combination of dimensions may be presented to the viewer. This will mean that the viewer will see an area rather than a single dimension. Due to the comparatively thin nature of the tail boom a helicopter would be best represented by an ellipsoidal shape showing a minor and major axis with major axis represented by the visible length of the helicopter.
Relative movement
An object will be more easily perceived, regardless of where it is in the field of view, if there is relative movement between the object and viewer (Hobbs, 2004). This is due to the human brain’s evolutionary adaptation to perceive movement as an indicator of threat. In general, aircraft on collision courses will not move relative to one another and so the eye will take longer to detect the approaching aircraft. The perception and placement of relative movement in the field of view is assisted where there is a stationary object, such as a structure, past which the object is moving. Under ideal conditions where there is a stationary reference point near the target, movements of 0.017–0.034° of arc per second may be detected. When no such references are available it will require a 10-fold increase in movement for detection (ATSB, 2002).[18]
Strobe or other aircraft lighting may be used to create apparent movement or a focal point that attracts the viewer to the object.
There has been a range of studies assessing the effectiveness of various lights on people’s ability to see or perceive an object. When the viewer knows where to look, a light even of relatively low power can be detected. Where a light is required to attract the attention of a viewer, particularly where it is away from the central FOV, it needs to be 5–10 times brighter than when a person is already alerted to the location and is simply looking for confirmation (Bullough, 2011).
Scene relative movement
Scene relative movement is defined as the movement of an object relative to the scene around it from the perspective of the viewer. Typically, this will be created by the object moving across the background. For example, an aircraft moving across the sky is detectable by a stationary observer on the ground.
If the viewer is moving, then a stationary object is more likely to be detected as the observed background scene will change, creating apparent movement. The impact of this will change depending on the scene. If the scene is relatively constant, such as a clear blue sky, then it will be of minimal assistance as there is minimal change in the scene as the viewer moves. Alternately in a busy scene, such as a cityscape, with changing buildings and colours the object is more likely to be detected as the scene will change more frequently and significantly behind the object.
Further, where there may be little to no relative movement between the object and viewer (such as aircraft on a collision course), the motion of the object through the scene can create an increased detection opportunity with the object crossing stationary references in the scene, drawing the viewer’s attention, while remaining in a constant relative position to the viewer.
Reaction time
Once an object is perceived by the viewer it takes time for the person to identify it, realise it is a threat, determine the appropriate course of action and implement that course of action (ATSB, 2002). In the case of aircraft approaching one another, the implementation of that course of action will not only require an input to the controls from the pilot but also a reaction from the aircraft.
The investigation considered 2 alternate responses for reaction time, non-urgent and urgent. For the non-urgent response, a person identifies a threat and has time to assess it, determine a course of action and respond. For the urgent response, the threat is not detected until it is in close proximity and elicits an instinctive or startle response from the operator.
Non-urgent response
Based on a range of research, the FAA published an advisory circular that defined standard times from pilot perception to the aircraft reaction. This table showed that the total time required was 12.5 seconds. Of this the 2 most significant portions are the determination that the other aircraft is on a collision course and determining the appropriate course of action. These 2 elements make up 9 of those 12.5 seconds. Table 3 is taken from the relevant FAA Advisory circular (AC 90-48E).
Table 2: Aircraft identification and reaction times chart
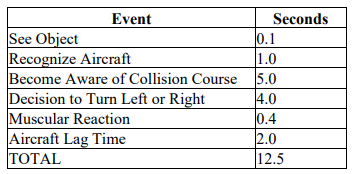
Source: Federal Aviation Administration
Theoretically, this means that under regular conditions, with no alert or guidance, if an object on a collision course is perceived less than 12.5 seconds prior to impact then the impact will occur regardless of a pilot’s attempted evasive actions. The time available for pilots to react can be increased through the provision of an alert to the pilot to traffic that poses a collision threat and provides an estimate of the location. This may be provided by an air traffic control service, a radio transmission or via an onboard aircraft collision avoidance system (ACAS). Some systems can even provide a manoeuvring recommendation to resolve the conflict (a ‘resolution advisory’) if the aircraft are on a collision course.
Urgent response
ATSB analysis of a previous mid-air collision assessed avoidance response times to unexpected events. This analysis was based on road safety work conducted by Summala in which drivers were required to respond to an unexpected event (ATSB, 2002). The ATSB estimated the pilot’s response time would likely to be between 1.5 and 3.5 seconds. It was assessed that when a pilot response was required to avoid nearby traffic, the more time and distance a pilot has, the more time the response will take as assessing the threat and determining the response become more difficult.
Once the pilot has selected a course of action, they must execute it and the aircraft must respond. From Table 2, these elements of the response require a combined 2.4 seconds.
Based on these estimates if the pilot sighted and perceived the threat when at close range it would likely take between 3.9 and 5.9 seconds from the time the threat was identified before the aircraft had responded.
Complex backgrounds
To identify a target aircraft, the viewing pilot must detect it among other objects in the background. Depending on the approach profile, this background may include clear or cloudy skies, open water, and various terrain from open and flat to heavily forested or mountainous areas.
The human eye uses shapes and the borders between them to differentiate between objects in the field of view. Where objects are close to or overlap one another the shapes or outlines of those objects interact. This is referred to as ‘contour interaction’ and effectively camouflages the shape of both objects (Hobbs, 2004). This contour interaction is most problematic where there is little to no relative movement, a background is complex, containing a range of various shaped features with differing contours, and the background and object are close to one another meaning the contours in the background are more pronounced. Contour interaction affects both peripheral and foveal vision, but it is a more significant problem further out into the field of view (Hobbs, 2004).
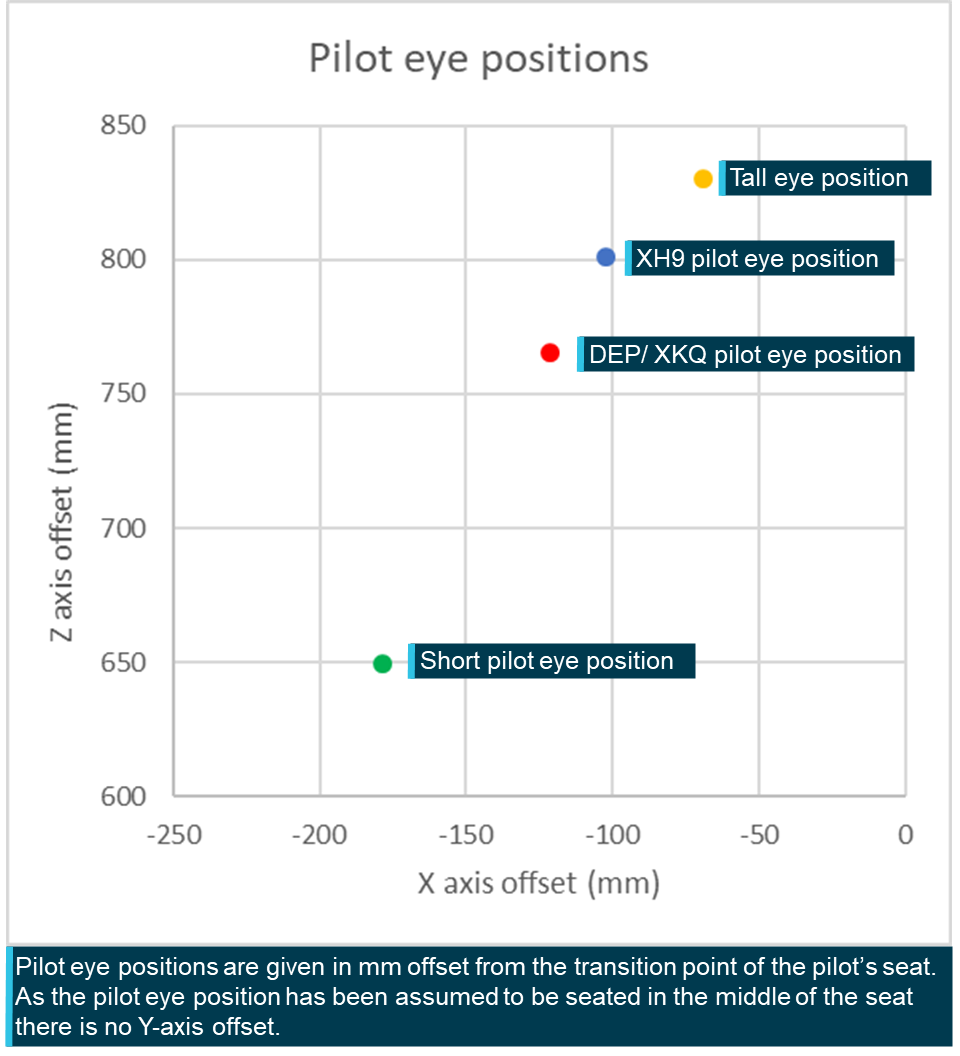
Pilot eye position
The pilot’s eye position relative to the cockpit structure depends on the pilot’s biometrics, the seat position and the way that they are seated in the cockpit. The EC130 B4 has a design eye position from which it is intended that the cockpit be viewed from. The ATSB obtained this position from the manufacturer and located it within the 3D model of the aircraft, refer to Locating the design eye position.
The ATSB, in collaboration with IWI, reviewed the pilots’ head positions from the video footage from inside the aircraft. This indicated that the head of the pilot of XKQ was positioned at the design eye position and the head of the pilot of XH9 was slightly above the design eye position. The eye position of XH9’s pilot was subsequently moved 19 mm backwards and 37 mm upwards.
In the development of the , to assess the impact of variation of the vertical and corresponding lateral movement of the eye position of a taller or shorter pilot, the ATSB, in consultation with IWI, further defined 2 additional head positions.
As the DEP was designated to represent a 50th percentile pilot, 2 additional positions were defined for 25th and 75th percentile pilots and are referred to as the short and tall eye positions respectively. The short eye position located 116 mm lower than the DEP and tall eye position 65 mm above the DEP (refer Figure 20). Due to the shape of the seat and headrest a change to the pilot’s head position will also introduce a lateral movement. For the short eye position 57 mm forward and for the tall eye position 52 mm rearward.
These positions will be used in the to demonstrate the effect of vertical and corresponding lateral movement of the pilots on the visibility of the target aircraft.
Figure 20: Pilot eye position offsets
Source: ATSB
Field of view
A pilot’s field of view (FOV) or visual field, measured in azimuth and elevation angles from the eye, determines how far from the centre point an object can be effectively located. This field will vary from person to person and can change based on a range of factors including age, the geometry of the face and head and existing visual conditions/diseases. A field of view consists of a central binocular area, visible to both eyes, with monocular areas, visible to only one eye, outside. The FOV typically traverses through approximately 200° of azimuth and approximately 135° of elevation with a slight bias towards downwards perception (Boff & Lincoln, 1988) (Wolfe, Dobres, Rosenholtz, & Reimer, 2017).
Human vision has 2 distinct types of photoreceptors for interpreting visual information, cones and rods. The cones operate at higher light levels and as humans tend to operate in higher light level conditions, either natural or manufactured. Most human vision is mediated by cones. Cones are predominantly located within a small central area of the visual field, the fovea, where vision is the most detailed. Rods, which are spread more broadly across the eye are more sensitive to both light and movement, but the image that they produce is less detailed (Hadjikhani & Tootell, 2000).
The fovea covers 1–2° at the centre of the FOV. Once outside of the fovea, the number of cones is reduced, and subsequently visual acuity will decrease and objects appear less sharp. Visual acuity reduces at 2 distinct rates depending on whether an object is more or less than 30° from the centre of the FOV. Between the fovea and 30° the loss of visual acuity is less extreme than beyond 30° (Strasburger, Rentschler, & Juttner, 2011). In addition, between 10° and 30° from the centre of the FOV, luminance contrast threshold of the eye plateaus, before increasing further out (Poppel & Harvey, Jr, 1973). The combination of these factors means that within 30° lesser contrasts and smaller objects can be identified when compared to outside of 30° in the remainder of the visual field.
Outside of 30° visual acuity is reduced further and the luminance contrast threshold increases. Subsequently objects will need to be both larger and have increased contrast to enable detection. The combination of this and the movement sensitivity of the rods, which more heavily mediate vision away from the fovea, result in a movement being key to detection beyond 30° from the centre of the FOV. In Ergonomics in the Automotive Design Process (Bhise, 2012), the role of these 3 areas in driving are summarised as follows.
During driving, the foveal visual field is responsible for detailed vision to read details such as highway signs. The central field [inner vision from the fovea to 30°] provides visual information (i.e. presence and locations) on most targets such as [the] roadway, other vehicles, and traffic control devices. The peripheral vision [beyond 30° from the centre] provides awareness of larger targets (e.g., vehicles in the adjacent lanes) and provides information on moving targets and motion cues.
For this study we will be referring to these 3 areas.
- The foveal region covering approximately the central 1–2°[19] (both azimuth and elevation) of the visual field. This region is particularly dense with cones providing the highest level of visual acuity.
- The inner visual field, defined as 60° of azimuth and 60° of elevation split evenly around the centre of the field of view (30° from the centre).
- The full visual field is the remaining area that a person can see (up to approximately 200° of azimuth and approximately 135° of elevation). This may also be referred to as the outer periphery.
Figure 21 shows an exemplar silhouette of an equirectangular 360° view of a Vans RV-8 aircraft cockpit showing the 3 visual areas of the FOV. Due to the internal structure of the eyes, and the structure of the face a more realistic individual representation, developed by NASA (Parker & West, 1973) is also shown on Figure 21.
Due to the range of individual variations to the FOV, throughout this report an idealised rectangular view will be used to describe the pilot’s visual field. It is worth noting that while all objects in the field of view might be visible to the pilot it is unlikely that all objects, particularly ones on the extremities or in areas where there is a large amount of visual clutter or activity will be detected (Gibb, Gray, & Scharff, 2010).
Figure 21: Fields of view example
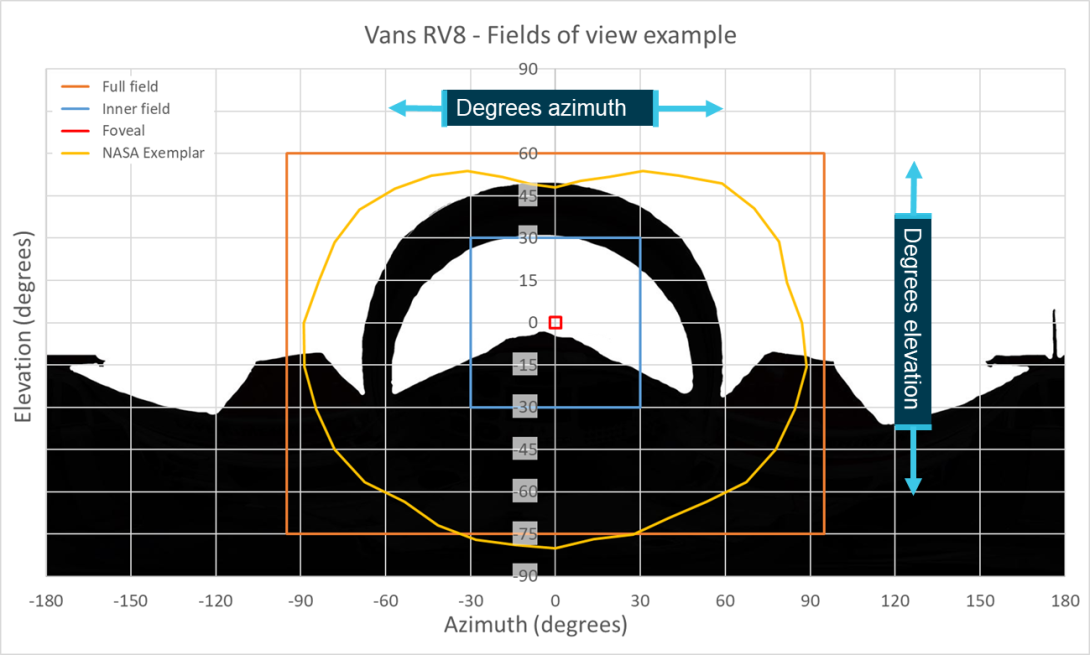
Source: ATSB
Pilot scanning
To improve the effectiveness of ‘see-and-avoid’ pilots are trained to visually scan the airspace around them for potential threats. This is usually combined with an internal scan of the aircraft’s instruments.
General guidance is to ensure that the entire visual field is scanned by moving and rotating the head to reveal objects otherwise lost behind aircraft structure or in visual traps.[20] The FAA recommends a series of regularly spaced eye movements that cover approximately 10° of the visual field and where that area is focused on for one second to allow the eye to adjust and focus in this area to enable detection.
It is further recommended that external viewing occupies 66–75% of the scan time, with the remainder spent scanning instruments and looking inside the aircraft (FAA, 2017).
Visual conspicuity
Lighting
Lighting can increase the opportunity for visual detection by providing a point of increased contrast on the object compared to the background. The visual detection opportunity can be further increased using apparent movement, such as rotation (beacons) or flashing (strobe lights) of the light to attract the viewer’s attention to the object.
Regulatory background
Chapter 11 of the Manual of Standards for Part 133 (Australian Air Transport Operations—Rotorcraft) of the Civil Aviation Safety Regulations outlines the equipment required for Rotorcraft operations in Australia. Division 5 identifies that an aircraft operating under day VFR is required to be fitted with anti-collision lights that must consist of at least one red beacon light or 2 white strobe lights or a combination of beacons and strobes. These lights are required to be displayed from immediately before the engines are started until the time the engines are shut down at the end of the flight.
If the aircraft is to be operated at night, it must also be equipped with landing lights and navigation lights.
Both XH9 and XKQ were certified for day VFR operations and although not required, taxi, landing and position lights were installed on both aircraft. Refer to the relevant aircraft information sections for further details.
Operational requirements
The Sea World Helicopters flight crew operations manual for the EC130 helicopter required the following 3 procedures to be followed for the use of external lighting during operations:
- Anti-collision beacons shall be left ON at all times, even after shut down to warn of accidental battery activation;
- Strobe lights and Nav [position] lights are to be activated before start and deactivated after shutdown.
- Landing lights shall be ON prior to departure and OFF once the aircraft has landed
Under these operational requirements both aircraft should have had beacons, position, strobe, and landing lights all active in the lead‑up to the collision. Neither aircraft was fitted with strobes at the time of the collision.
Visibility
There has been a wide body of research into the effectiveness of aircraft lighting in improving visual detection of aircraft. A range of agencies around the world have encouraged aircraft owners and operators to fit anti-collision lights. The luminance of traditional aircraft lights meant the presence of these lights was of minimal advantage particularly in bright background lighting conditions such as those experienced in daylight (Hobbs, 2004).
Much of the available research into the effectiveness of aircraft lighting was carried out prior to the introduction of light emitting diode (LED) lighting when standard lighting intensities were in the order of a maximum of 300–400 cd. Figure 22, reproduced from (Hobbs, 2004), shows that for these lights to be effective at 3 nautical miles, background luminance cannot be more than approximately 30 cd (equivalent to a very dark day). On a full sunlit or even an overcast day lights of this power this would not be sufficient for an operator to see let alone draw attention.
Figure 22: Required effective intensity of lights at 3 nautical miles
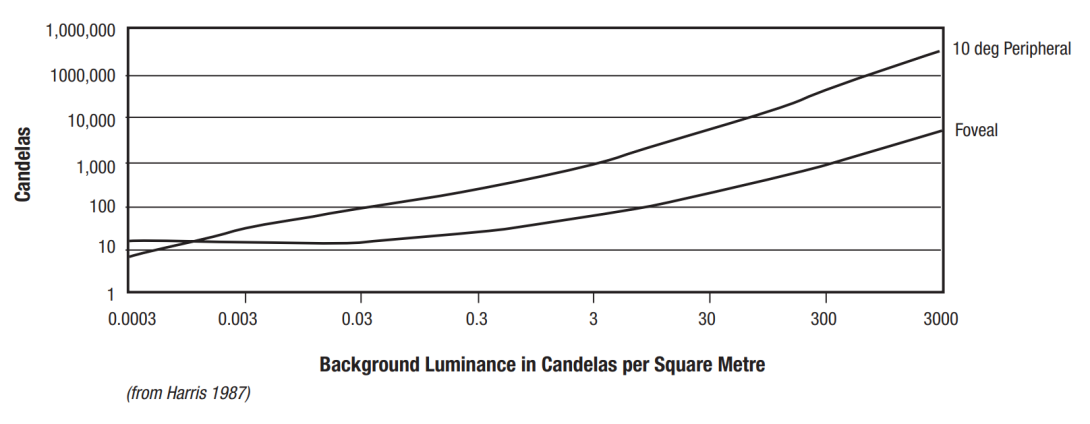
Note: The top 2 y-axis values show 1,000,000, based on the progression of the logarithmic scale the value above 10,000 should read 100,000. Assuming this progression and the lack of comma between the 1 and first 0 it is assumed that this was a typographical error in the source chart. Source: Harris (1987) in Hobbs (1991)
The detectability of a light is also dependent on its directionality or the spread of the beam. The further from the centre of the beam that an observer is, the less bright the light will appear and the less likely it is to aid detection. Some lights, such as landing or approach lights, specifically illuminate certain areas around the aircraft and subsequently the beam is focused on a particular direction. For visual conspicuity this can aid the distance at which the light may be detected but only from angles at which the light is directed.
Currently available lighting
Over the past 15–20 years LED technology has become more commonly used in almost all lighting applications including aviation lighting systems. Due to lower power consumption, higher brightness and longer lifetimes, LEDs provide a significant advantage over the traditional incandescent or halogen bulbs (US DOE, 2022).
The provision of these improvements has led the FAA to encourage the use of landing lights when an aircraft is operating within 10 NM of an airfield or below 10,000 ft (FAA, 2020). The low power consumption and increased brightness of modern LED landing lights provide for visibility at significant distances even in bright daylight. For example, the sunspot series of LED landing lights produced by AeroLEDs in the United States have candela ratings between 150,000 and 420,000 (AeroLEDS, 2021) which is more than sufficient for a light to be seen at distances of 3 NM even outside of the foveal region of highest visual acuity (Figure 22).
Contrast
Visual contrast is the difference between colour or luminance between either an object and its background (external) or different parts of the object itself (internal). The greater the contrast between the 2 elements, whether internal or external, the greater the likelihood of detection.
Factors affecting visual contrast include the power and location of the light source, the target’s colour, reflectivity and its position and orientation towards the viewer and for external contrast, the colour and reflectivity values of the background. Contrast may also be affected by intermediate structures or materials, such as the use of tints to windows, or by apparel of the viewer with the use of sunglasses or light enhancing glasses.
Contrast values can be calculated where all the relevant parameters can be derived or assumed based on known conditions and aircraft fitment. Where these parameters are not known contrast can be assessed using video footage. While the lens of the camera and the human eye have different characteristics and capabilities in detecting colours and responding to changes in light patterns, video can give an estimation of the contrast experienced by a viewer at the time.
Internal and external contrast can have overlapping effects so a colour scheme that contrasts within the body can also contrast against the background that the body is seen against. High‑visibility rotor blades and the aircraft colour scheme can be used to create contrast on a helicopter.
High‑visibility rotor blades
Due to the speed that the rotors move, when they are a single colour the rotor disc of a helicopter effectively becomes see through, reducing visual detection opportunity. To improve detectability from above,[21] the main rotor blades can be coated with strips of contrasting colours. As the blades rotate this creates, to a viewer looking at the aircraft from above, a series of concentric circles of either different colour where multiple higher luminosity colours have been applied or colour and blank where only strips of a single high luminosity colour have been applied. In Figure 23, the left panel shows yellow blade sections being used to contrast with the cityscape background to improve detectability[22] of the disc. The right panel shows the use of alternating red and white sections to contrast both with one another and the green field over which the aircraft is flying. Alternately, the centre panel shows an aircraft not fitted with high‑visibility blades showing the difficulty in detecting the rotor disk.
Figure 23: Examples of use of high‑visibility rotor blade schemes
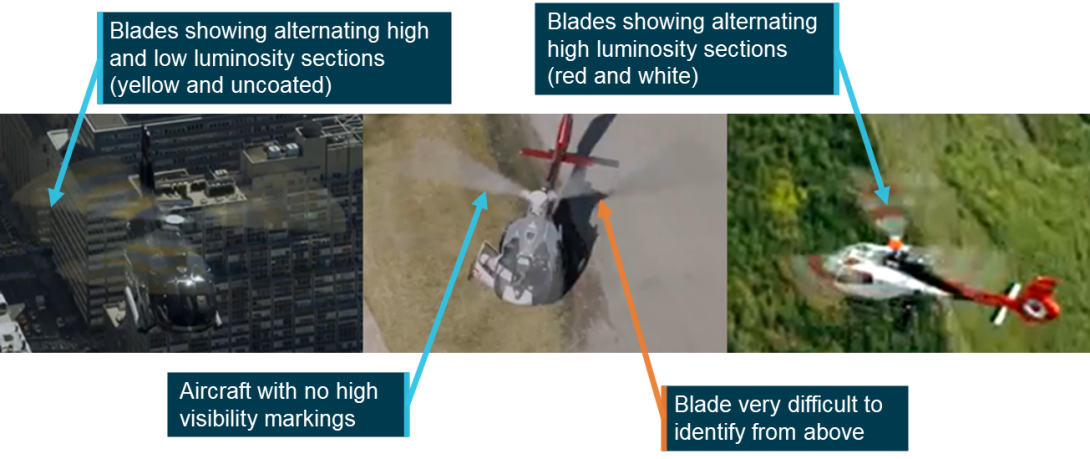
Note: As the images shown are freeze frame, the impact of the high‑visibility paint scheme depicted is reduced. When the blades are rotating, a compete circular array is visible from above. Source: Airbus Helicopters, annotated by the ATSB
It is important to note that the fitment of high‑visibility rotor blade schemes is not mandatory or standard fitment for new EC130s.
Aircraft colour schemes
The typically lower closure speeds of helicopter operations when compared to fixed wing aircraft mean that the aircraft can be in closer proximity and still have an appropriate amount of time to manoeuvre to effectively avoid one another. This closer proximity means that the aircrafts’ surfaces and their colourisation are more obvious to the viewer.
The use of high luminosity colours such as yellow, red or white in large blocks on the fuselage gives the ability for both internal and external contrast. These colours can actively contrast with one another and a variety of darker or low luminosity backgrounds, subsequently it is common to see these colour schemes on medical evacuation or search and rescue aircraft. This will improve conspicuity not only assisting other aircraft in identifying them but also persons on the ground. It is again important to note that colour scheme is only one element affecting conspicuity. For those on the ground audible conspicuity is often important as it is possible to hear an aircraft much earlier than sighting one even with a high‑visibility paint scheme.
Depending on the background an alternate way to improve conspicuity is to use a very low luminosity colour scheme. By painting an aircraft, or a section of the aircraft black, the same effect can be achieved as having a high luminosity colour scheme. In this case instead of the target luminosity being higher than the background the target luminosity is considerably lower. This is only an effective use of contrast if the background is sufficiently luminous for it to contrast with the aircraft. In late evening or afternoon operations where the background is growing dark this would not improve the conspicuity of the aircraft. Where a section of the aircraft is painted black internal contrast can be used to aid conspicuity without need to consider the colour or luminosity of the background.
Figure 24 below shows the same 3 helicopters as in Figure 23, except it considers the colourisation of the body of the helicopter rather than the blades. These images only represent a single snapshot in time from a particular angle, viewing the same helicopter from an alternate angle with a clear blue sky in the background may significantly alter the detectability with this paint scheme.
Figure 24: Examples of use of varying colour schemes
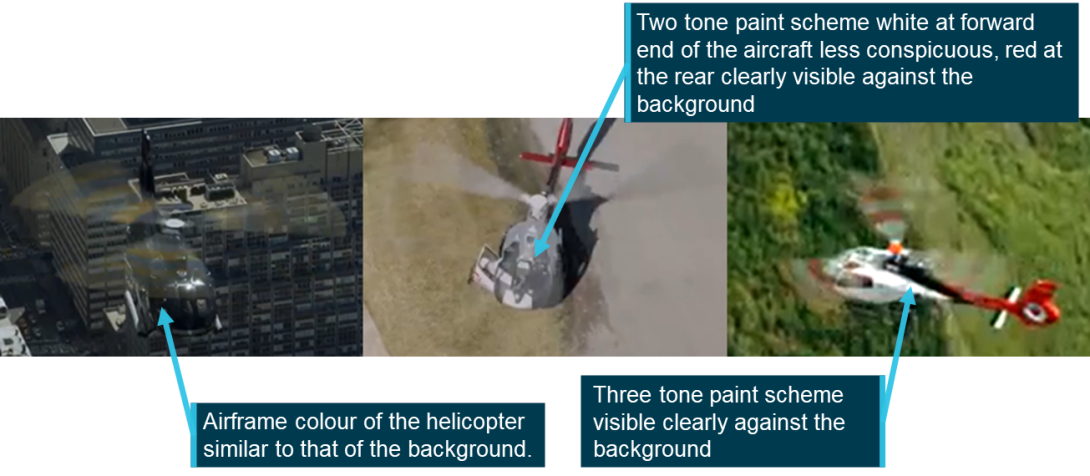
Source: Airbus Helicopters, annotated by the ATSB
The left panel shows the limitation to visibility when the colourisation of the helicopter is matched to the background with a dark grey paint scheme against the darker buildings.
The centre image shows a 2-tone paint scheme with either white or a light grey on the front of the aircraft and a red tail and fenestron. The image shows that the body colour blends into this background where the alternate colour on the tail has a higher contrast and is subsequently more visible increasing the likelihood of detection.
The right image shows an aircraft with a 3-tone paint scheme, the front being white, the rear being predominantly red with black and white stabilisers with the 2 colours separated by a black streak over the engine cowl. The red and white of the aircraft is clearly visible against the background presented, however the dark coloured streak would improve visibility if the aircraft was to be viewed against a higher luminosity background that the lighter colours may blend in to.
The advantage of the use of a paint scheme is that it is not visible from inside the aircraft so it is highly unlikely to cause any negative impact to the pilot and can subsequently be applied to all the aircraft’s surfaces making it more visible from all angles.
Surface coatings
Surface coatings may be used on the windows of aircraft to reduce sun glare or ultraviolet penetration. There are 2 types of surface coating that may affect the detectability of the target, these are a tint or a dappled surface. The dappled surface coating is designed so that the viewer can still effectively recreate the picture based on what they are seeing. However, if a target remains stationary, common with aircraft on intersecting trajectories, and the size of the target does not exceed that of the solid area of the coating it will not be visible to the observer. Where there is relative movement of the target aircraft the use of this dappled coating can exaggerate the movement with the target moving across the individual holes in the coating which can draw the viewer’s attention.
As tint does not introduce a solid obstruction from the viewpoint of the pilot it will not affect the target’s visibility. However, it can change both the colour and luminance of the target and background altering the likelihood of target detection. For example, if the tint reduces the luminance value of both the target and the background by half, the luminance values of both will be closer together, subsequently reducing the contrast and the associated visibility of the target.
Results and discussion
Introduction
This section outlines how human visual performance, aircraft position and orientation and aircraft structure affected each pilot’s ability to visually detect the other aircraft in the lead‑up to the collision. It will also detail some of the processes that the ATSB and IWI undertook to verify and correct relevant portions of the data based on the video footage from both onboard and external to the aircraft.
The chapter is broken down into 3 sections:
1. The first will examine the position and orientation (pitch, roll and heading) of both aircraft in the lead‑up to the collision.
2. The second will build on this data to determine where the approaching aircraft would have appeared in the viewer pilot’s field of view and the relative size.
3. The final section will examine the effect of the aids and challenges to conspicuity that were introduced in the previous chapter and how they would have impacted each pilot’s ability to visually detect the other aircraft.
This chapter focuses on the physical characteristics of detection by the pilot, it will not assess considerations around the pilots’ mental model or how the use of electronic conspicuity or identification devices such as TCAS, ADS-B In or electronic flight bag applications may have assisted either pilot with the detection of the other aircraft. Detailed analysis of these factors can be found in the investigation report.
Aircraft position and orientation
The AHRS data from XH9 and XKQ’s SpiderX units provided the basis for the aircraft position and orientation information used in this study. The AHRS data for the accident flight included 3‑dimensional position as latitude, longitude and altitude and 3-dimensional orientation as aircraft pitch, roll and yaw. The data was verified and, where necessary, corrected based on a comparison between the animation developed using this data and the footage both onboard and external to both aircraft.
Aircraft position
Lateral position
Lateral position information for both aircraft was recorded at 1 Hz on the second for both aircraft. The AHRS information contains latitude and longitude positions to 6 decimal places. For the purposes of this analysis this information was simplified by a conversion to rectangular cartesian coordinates. In this case, eastings and northings relative to a reference point on the earth’s surface. While these coordinates are not as accurate over a global scale as latitude and longitude, these rectangular coordinates, given in metres, allow for simpler calculation of position and proximity when working locally. For this study the ATSB utilised Geoscience Australia’s Geodetic Calculator[23] to convert the data from latitude and longitude to eastings and northings.
Calculations using eastings and northings are complicated by the size of the values that are encountered due to the reference point against which they are given which is often thousands of kilometres away from the position that is being referenced. To simplify these calculations a local reference point is utilised, and values are given relative to this local reference point. In this case the centre of the park pad was chosen as the local reference point due to its proximity to the accident site, being easily identifiable from satellite imagery and being the location that XKQ departed from. Figure 25 shows the flight paths of both XH9 and XKQ in rectangular cartesian coordinates relative to the centre of the park pad. Thirty second timestamps have been identified along XH9’s track to show the development of the flight from lift-off until the collision. An additional position has been identified showing the location of XH9 at the time that the inbound call was initiated.
Due to the complexity of the analysis required and the relevance of the information, the remainder of the analysis will not consider the whole of XH9’s flight path. The ATSB visibility analysis was initiated from 03:54:15 UTC as XH9 commenced its turn to the left to progress down the Broadwater. This time was selected as it was on a 15‑second divisor and it ensured that data relating to the detectability of XKQ during XH9’s progress down the Broadwater was fully captured. Due to the data processing and visualisation requirements involved with the development of the animation the animation was developed from 13:55:26, 16 seconds before XKQ departs the park pad. This allows the viewer sufficient time to understand the environment and situation before they are required to engage with the animation and assess the conditions that were involved. The AHRS data for both aircraft continued to the sandbar, the visibility analysis was stopped at the point of impact.
Figure 25: Aircraft flight paths in local cartesian coordinates
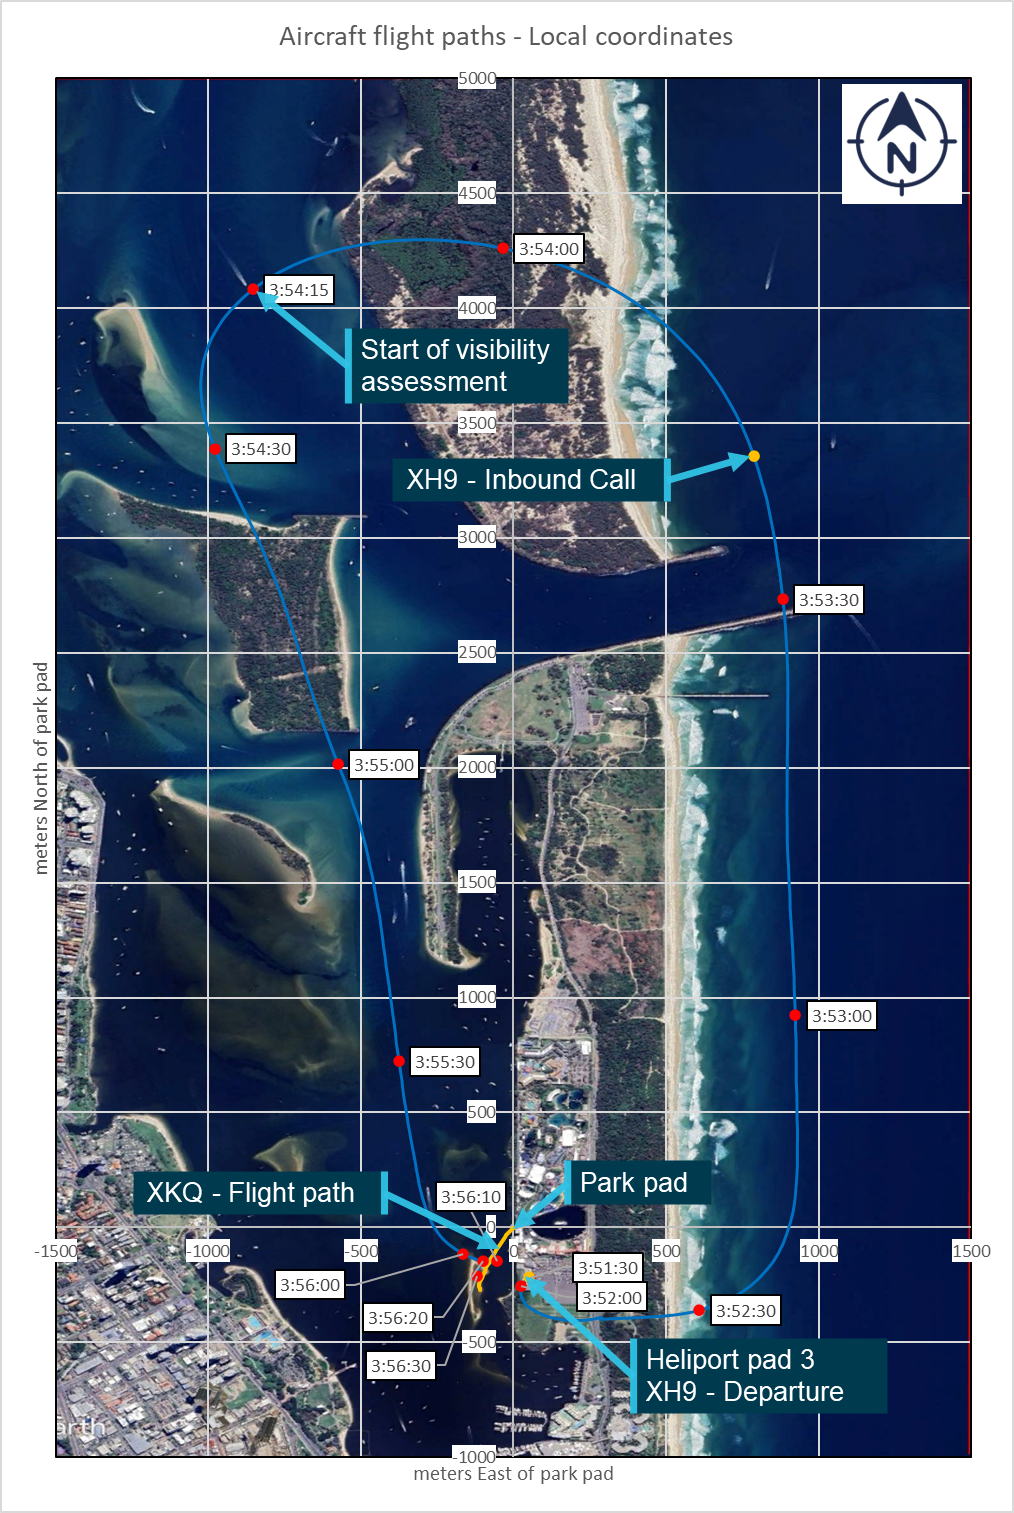
Note: Satellite image was taken near high tide. Sandbar was exposed at the time of the accident. Source: Google Earth and ATSB, annotated by the ATSB
Figure 26: Close up of collision location flight paths – local cartesian coordinates
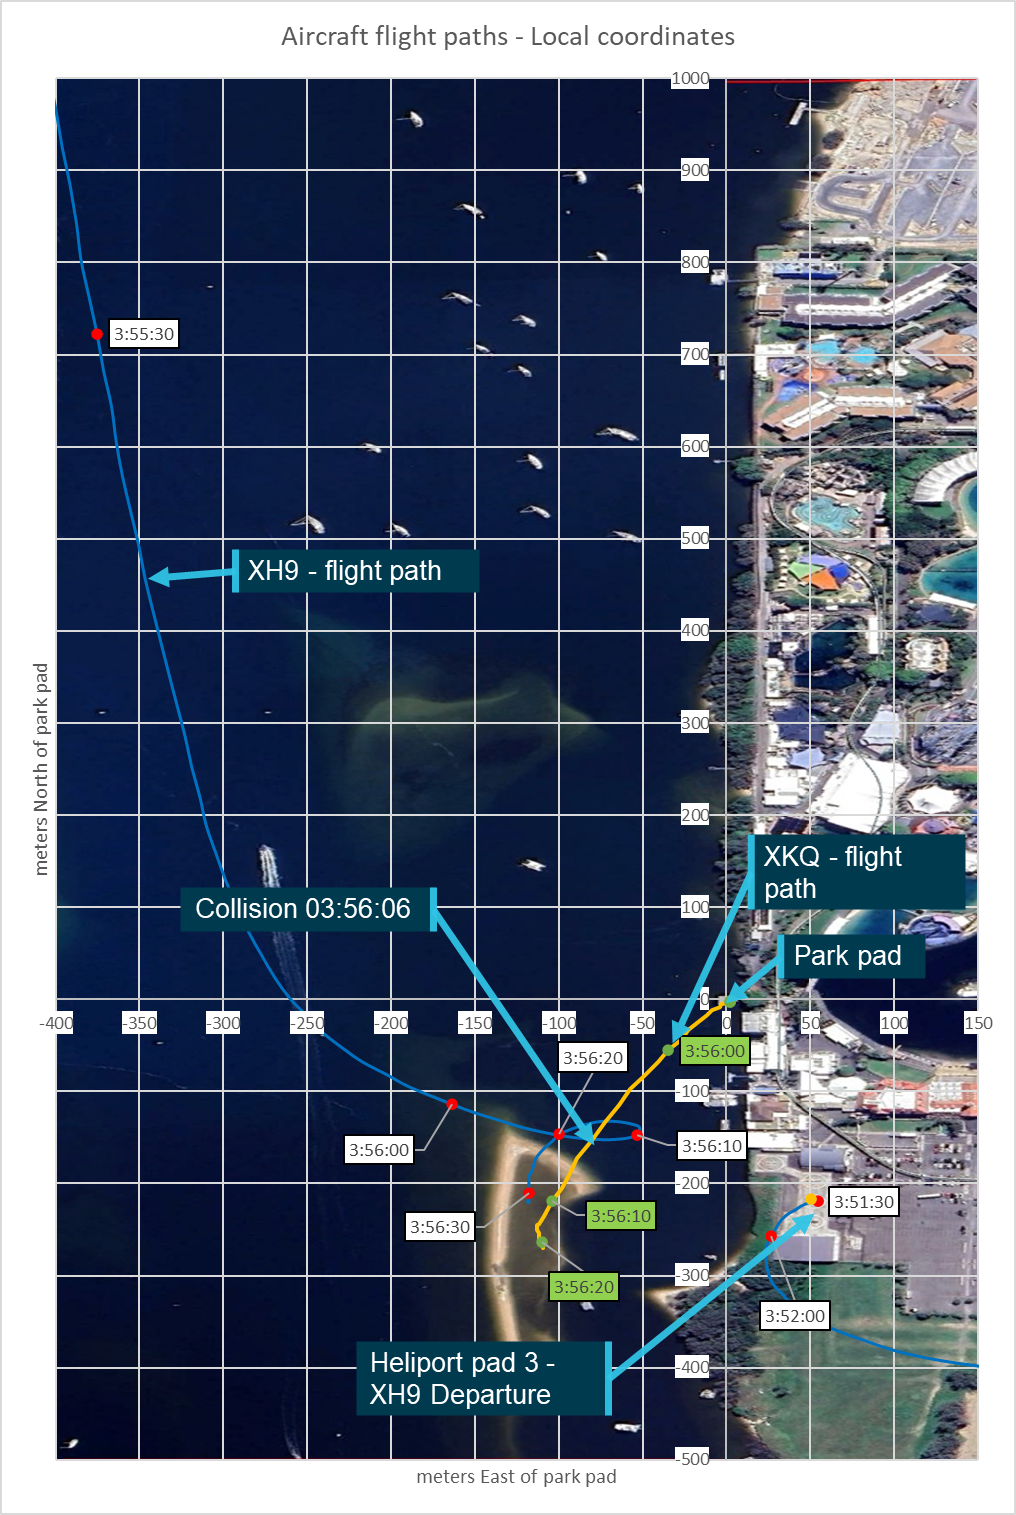
Note: Satellite image was taken near high tide. Sandbar was exposed at the time of the accident. Source: Google Earth and ATSB, annotated by the ATSB
Data verification
The data verification process did not identify any errors in position information that fell outside of the error margins as defined for the positional information.
Vertical position (altitude)
Figure 27 shows the corrected altitude profiles, converted from metres to feet, based on the Spidertracks AHRS data. The data shows XH9 descending from 560 ft holding, briefly, at approximately 420 ft before continuing its descent and approach to the pad. At approximately the time that XKQ departs the pad XH9 is continuing its descent through approximately 325 ft, continuing this descent as XKQ climbs out, with the 2 aircraft colliding at approximately 135 ft above mean sea level (AMSL).
Figure 27: Aircraft vertical profiles
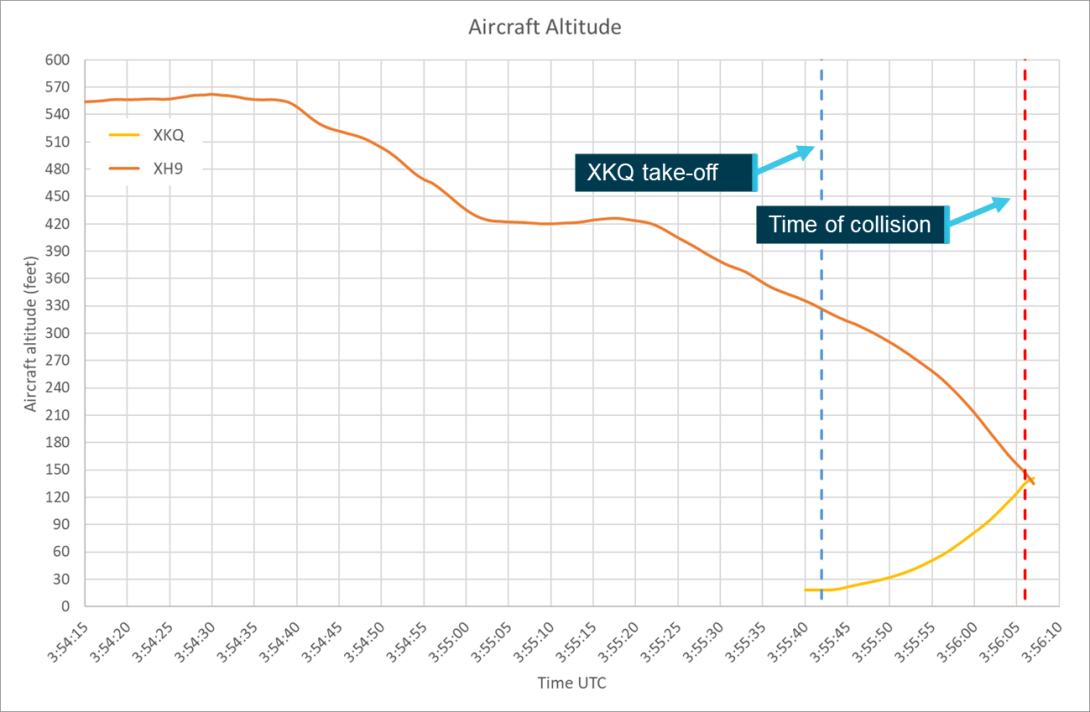
Source: ATSB
Data verification
The data verification process identified that the altitude of XKQ was overestimated by approximately 14 ft from the time it was on the pad until 4 seconds before the collision. Over these last 4 seconds the variation reduced to approximately 12 feet. This corresponded with the wreckage examination, as outlined in the investigation report, that determined that the initial contact of the main rotor disc of XKQ was with the lower fuselage of XH9 leaving approximately the height of the helicopter between the 2 Spidertracks units at the time of the initial impact.
Aircraft proximity
The relative size of the target aircraft to the viewer aircraft will be a factor of 3 elements, the dimensions of the target aircraft, the relative angle of the target aircraft towards the viewer and the distance between the 2 aircraft. This will depend on the difference between the lateral and vertical positions of both aircraft. Figure 28, Figure 29 and Figure 30[24] plot the lateral, vertical and total proximity of the 2 aircraft from 03:54:15 until the time of the collision. Until XKQ lifts from the pad the change in proximity is solely altered by the movement of XH9. XKQ’s initial climb out of the pad only impacts the vertical proximity of the aircraft. The lateral proximity continues to depend solely on XH9 until XKQ starts its forward motion approximately 5 seconds after it lifts from the pad (03:55:47). The 2 helicopters’ similar headings shortly after XKQ commences its forward flight means that the total proximity is more significantly affected by XKQ’s climb and XH9’s descent than the lateral approach until XH9 commences its final approach to the pad. At this point with the flight paths approaching perpendicular the lateral proximity closes more rapidly.
Figure 28: Aircraft lateral proximity

Source: ATSB
Figure 29: Aircraft vertical proximity
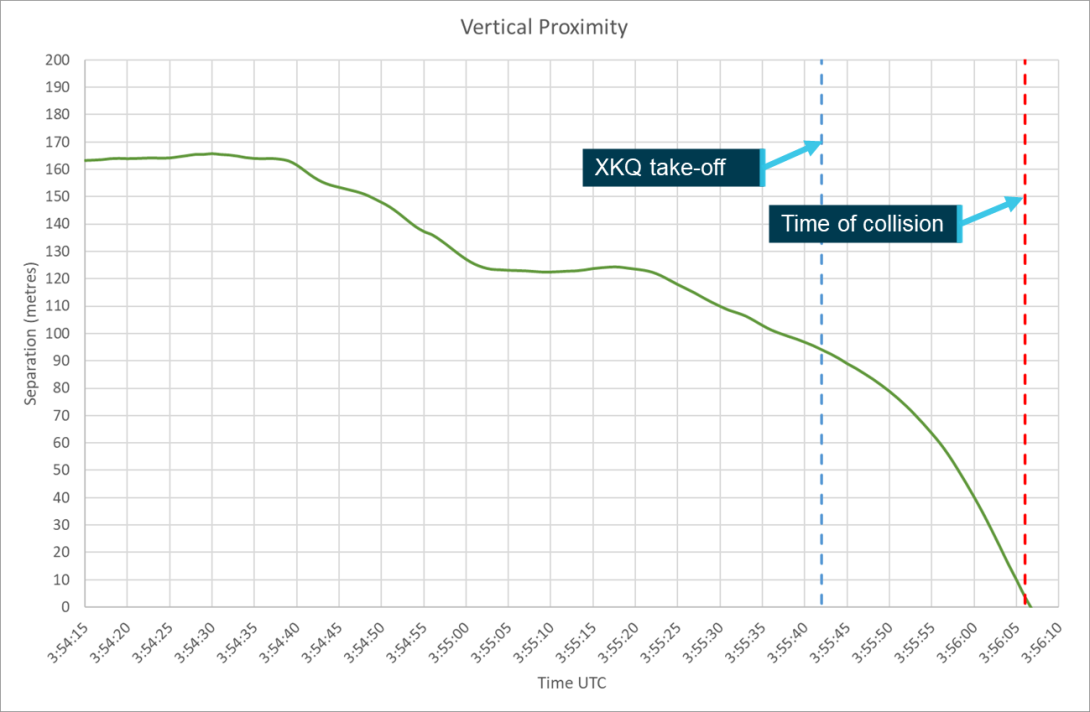
Source: ATSB
Figure 30: Aircraft total proximity
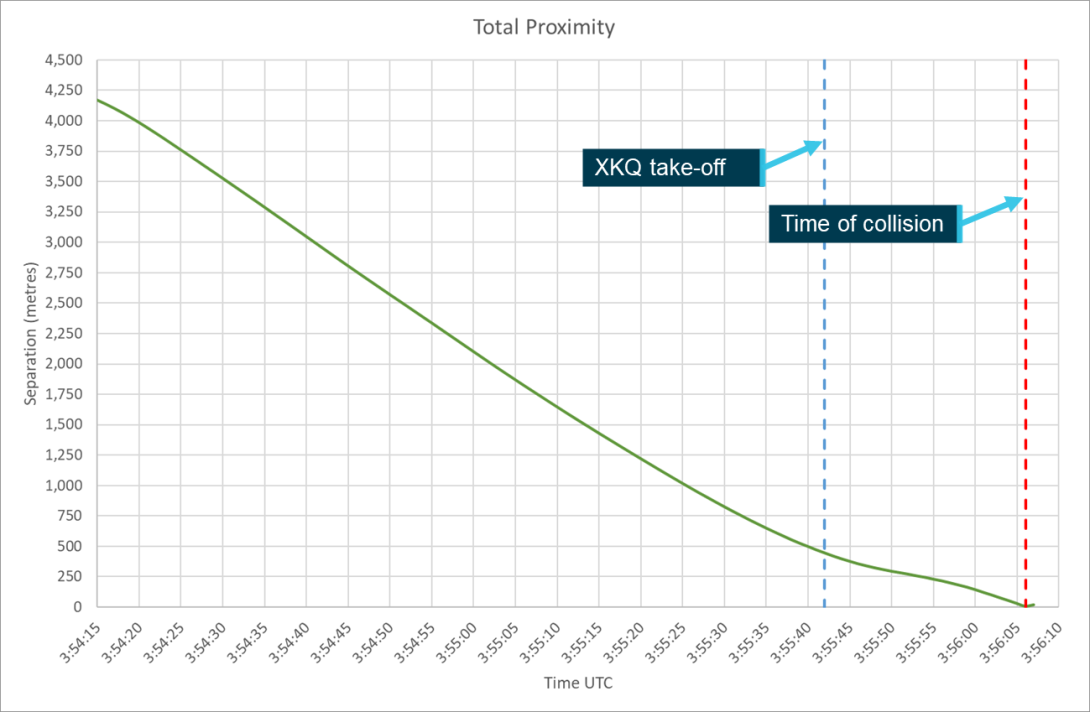
Source: ATSB
Aircraft closure rate
The ability for a pilot to react and manoeuvre their aircraft to avoid a collision depends on the amount of time that they have to identify a threat and respond. The time available will depend on the rate with which a threat aircraft is approaching. The higher the closure rate the less time that the pilot will have to assess that an approaching aircraft is a threat and respond to it. Helicopters hold an advantage over fixed wing aircraft in that they can hover in position reducing the effective closure rate between the 2 aircraft and providing more time to assess the collision risk.
The closure rate of XH9 and XKQ is calculated based on the vertical and lateral position information over time. Figure 31, Figure 32 and Figure 33 plot the lateral, vertical and total closure rates, based on unsmoothed data leading to the noise that can be seen in the charts. The lateral and total closure rates were calculated in metres per second and for the lateral rate converted to knots. The average total closure rate was calculated as 37 m/sec or 72 kts. The average total closure rate following XKQ’s departure from the pad was 18 m/sec or 36 kts. This corresponds with the flight paths with XKQ departing the pad behind XH9 and initially tracks on a similar heading. The closure rate increases when XH9 makes its turn towards the heliport pads and the tracks become closer to the perpendicular.
Figure 31: Lateral closure rate
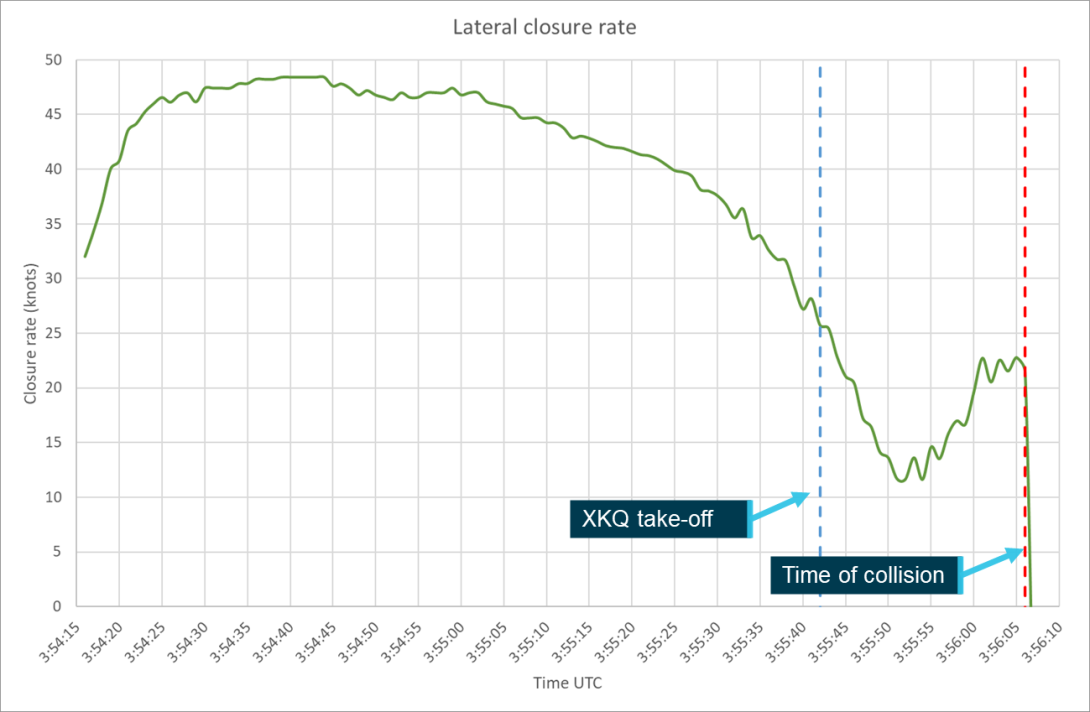
Source: ATSB
Figure 32: Vertical closure rate
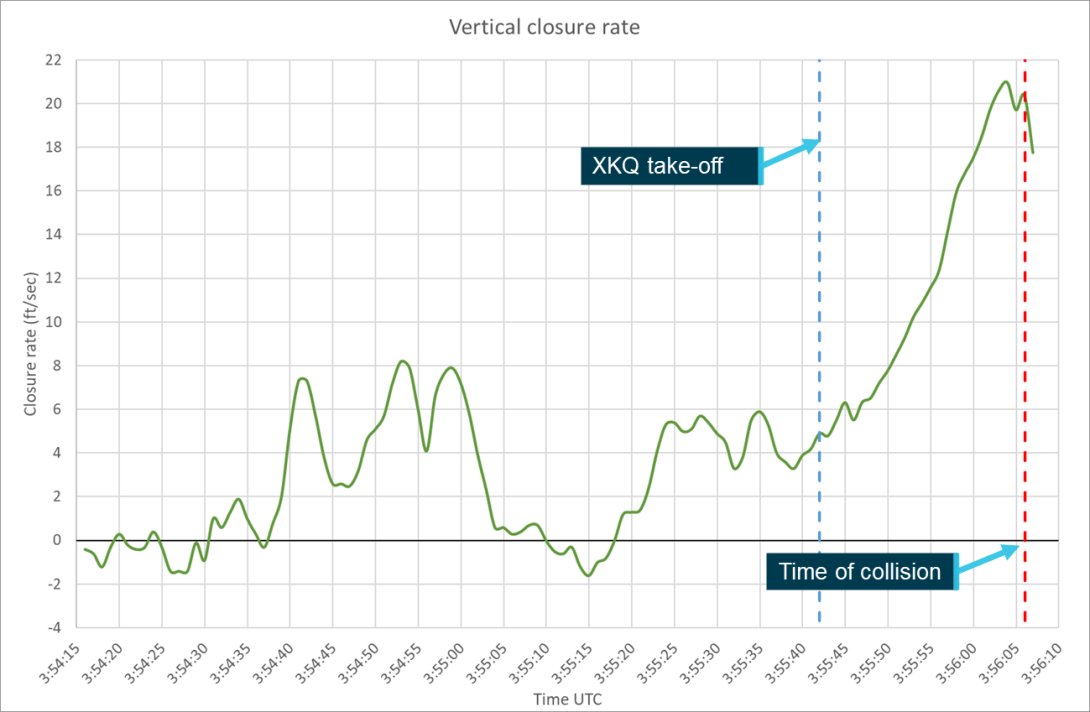
Source: ATSB
Figure 33: Aircraft closure rate

Source: ATSB
Aircraft speeds
The aircrafts’ groundspeed can be relatively easily derived from the lateral position information that was downloaded from the AHRS unit. The aircrafts’ airspeed is a function of the groundspeed of the aircraft, the windspeed and wind direction relative to the aircraft. While not necessary for the further analysis the airspeed was calculated based on the aircraft position information and windspeeds. As outlined in the investigation report the winds on the day were approximately 15 kts gusting to 25 kts and were out of the south‑east meaning that it was approximately a quartering head wind for both aircraft tracking south and a head wind for XH9 as it approached the heliport from the north-west. Figure 34 below plots the groundspeed and estimated aircraft airspeed over time assuming a constant 15 kt wind from the south-east 135° true.
Figure 34: Aircraft speeds
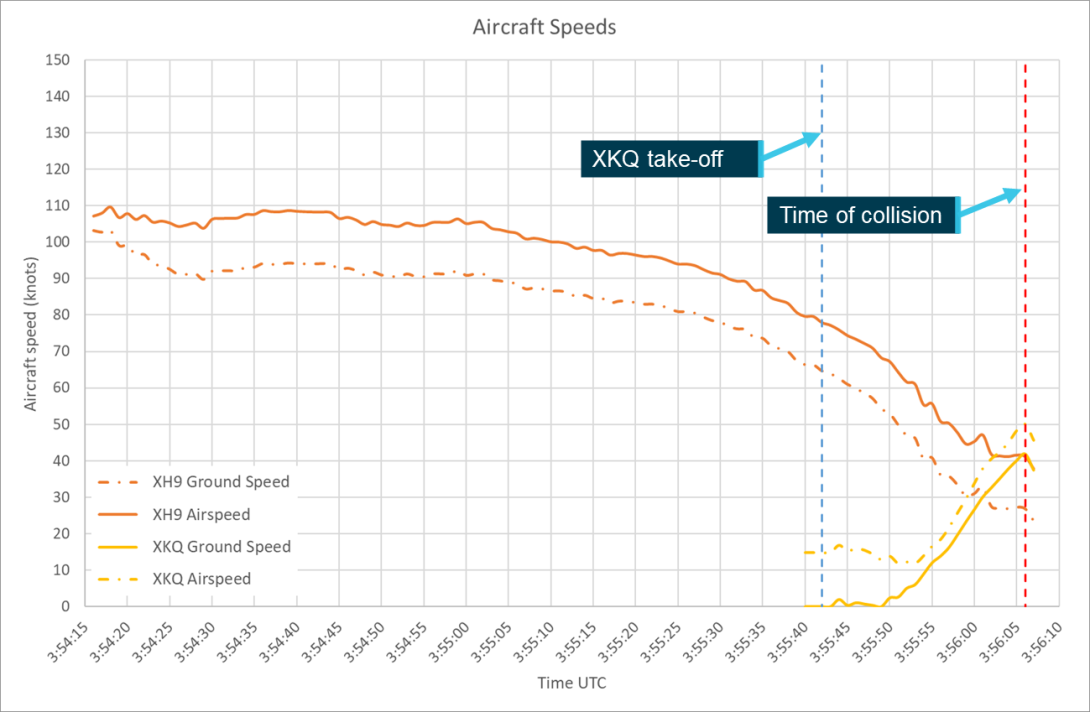
Source: ATSB
The Spidertracks AHRS unit also records vertical speed in metres per second based on vertical position information received from the GPS unit. The ATSB used the corrected vertical position information from the AHRS unit to confirm the vertical speeds that the AHRS unit was producing. As it had been determined that there were 2 constant offsets being applied, for the ellipsoidal error and to bring XKQ onto the pad, these would not impact the calculated vertical speed. Figure 35 shows the ATSB calculated vertical speed in comparison with the vertical speed value obtained directly from the AHRS unit. As the AHRS unit records vertical speed in metres per second the comparative analysis was completed in metres per second.
Data verification
The alignment between the recorded and calculated data is high, supporting the validity of the analysis that has been completed. The AHRS data shows 2 occasions for each aircraft where the data appears to spike. These occasions are the result of no data, represented as 0 being recorded for the vertical speed parameter in the AHRS data and so have no impact on the outcome of the analysis.
Figure 35: Vertical speed comparison chart
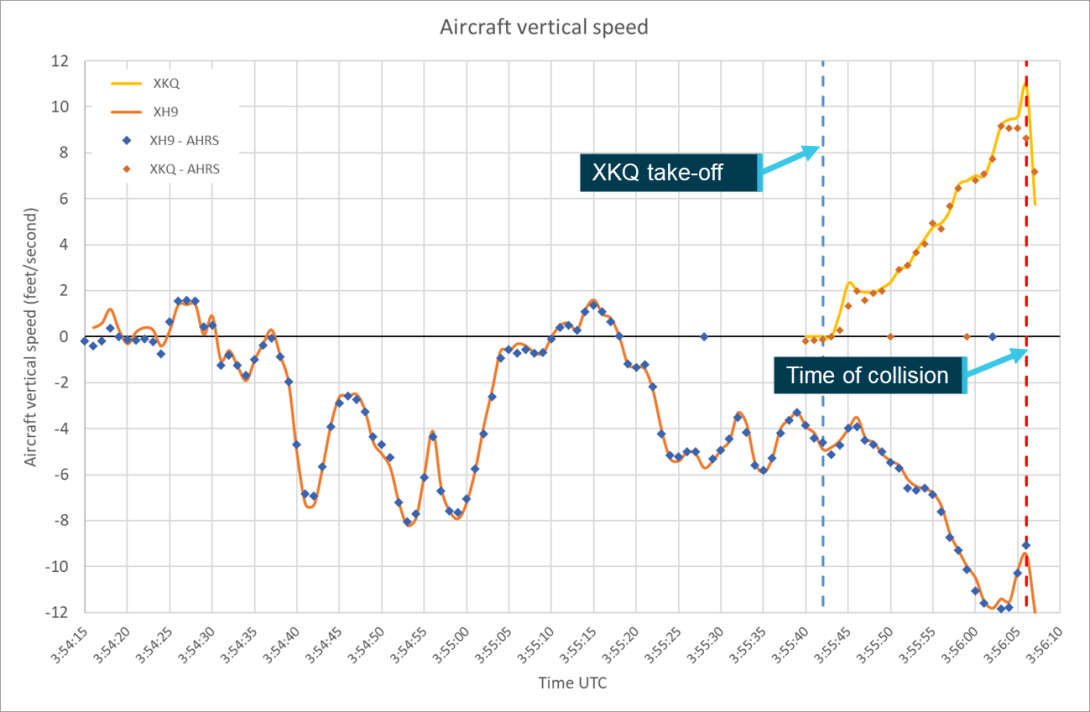
Source: ATSB
Aircraft orientation
Aircraft orientation is identified in 3 axes, pitch, roll and yaw. Each describes the rotation of the body of the aircraft around the relevant axis. The Spidertracks units fitted to both XH9 and XKQ used three dimensional gyroscopes to calculate pitch and roll and these gyroscopes combined with a magnetometer to determine the aircraft’s yaw around its central axis and subsequently the direction that the helicopter was oriented or its heading. This was corrected internally for the magnetic variation at the aircrafts’ location to give the unit’s true heading.
Pitch
The AHRS unit records pitch values in radians at 1‑second intervals. The ATSB converted these values to degrees and plotted them for both aircraft. Figure 36 shows the pitch values for both aircraft, XH9’s data is plotted from 03:54:15 and XKQ’s data from 03:55:40, 2 seconds before it lifts off the pad.
Figure 36: Aircraft pitch
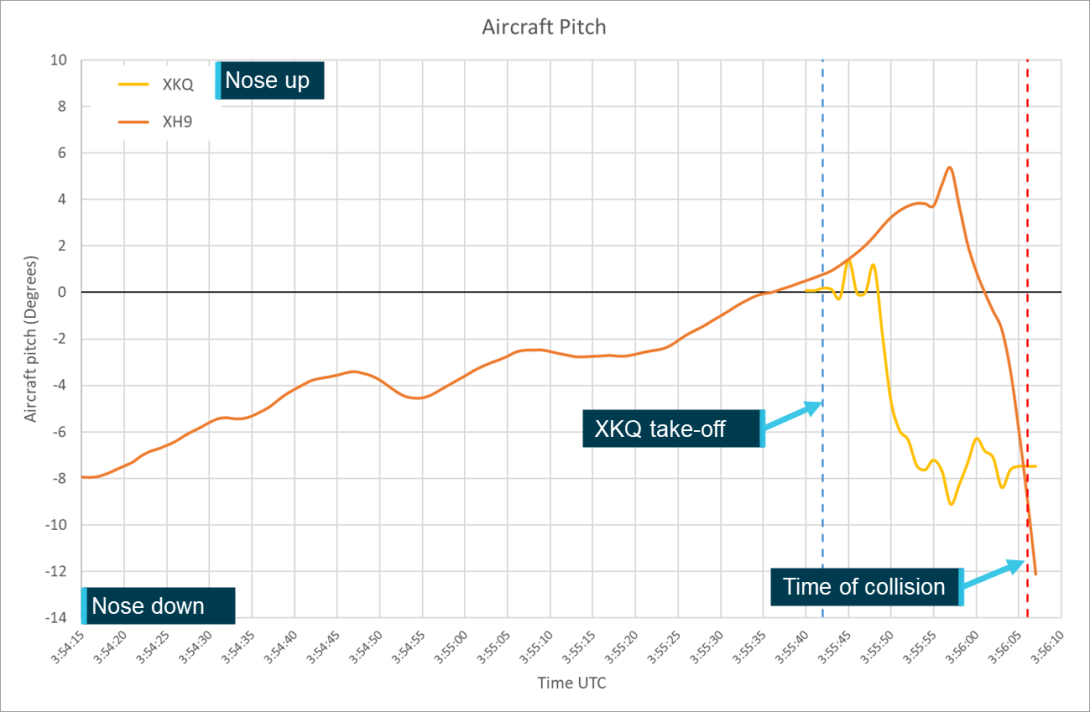
Source: ATSB
Data verification
The data verification process did not identify the requirement for any corrections to the aircraft pitch data.
Roll
The AHRS unit records roll values in radians in 1‑second intervals. The ATSB converted these values to degrees and plotted them against time for both aircraft. Figure 37 shows the roll values for both aircraft, XH9’s data is plotted from 03:54:15 and XKQ’s data from 03:55:40, 2 seconds before it lifts off the pad.
Figure 37: Aircraft roll
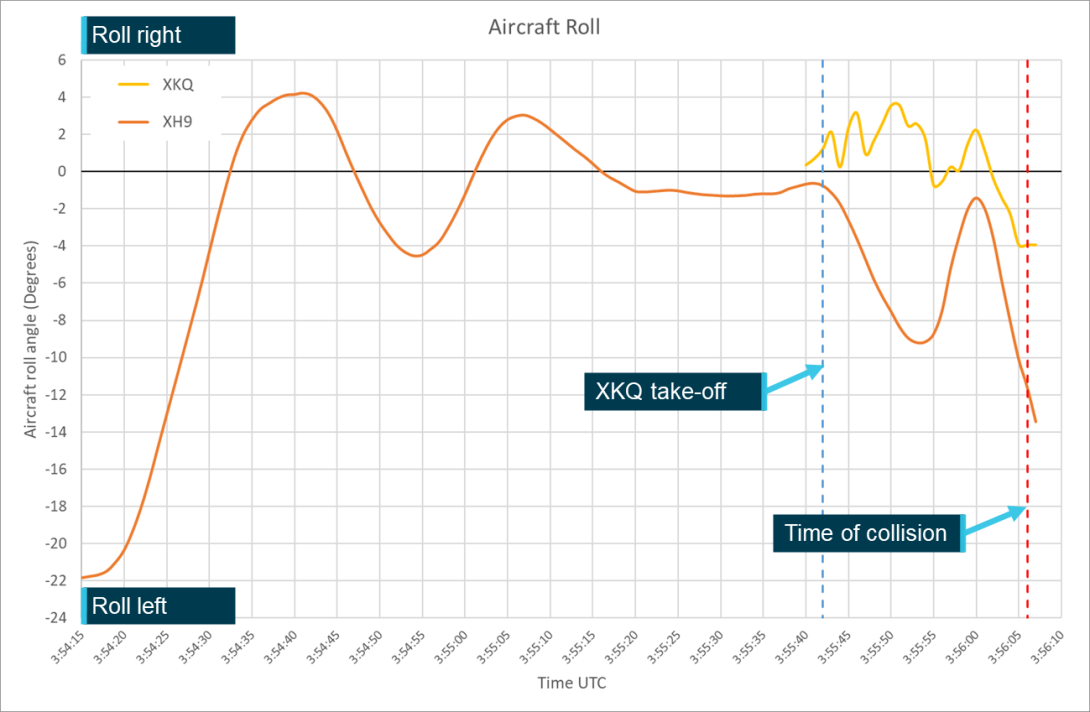
Source: ATSB
Data verification
The data verification process did not identify the requirement for any corrections to the aircraft roll data.
Heading
The AHRS unit records a yaw parameter in radians at 1‑second intervals. Based on an assessment of the helicopter location and movement, the ATSB determined that this parameter corresponded with the aircrafts’ true heading values. Figure 38 shows the heading values recorded by the AHRS unit.
Figure 38: AHRS recorded heading value
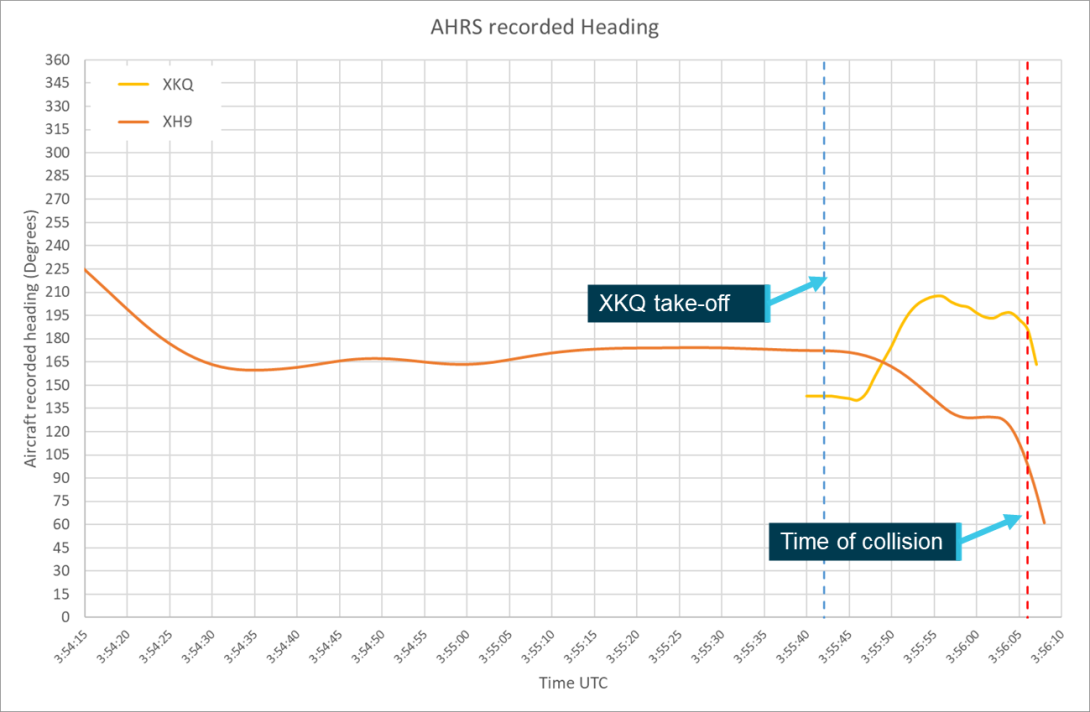
Source: ATSB
Data verification
The data verification process identified 2 corrections that were required to the heading of XH9. The first was a 10° heading overestimation that was throughout the study period. A review of the device’s positioning within the aircraft, the AHRS and raw sensor information and comparison with XKQ’s data was not able to determine the source of this error. Once the correction was applied the animation and onboard footage synchronised.
Figure 38 shows the need for a second correction associated with XH9’s heading rapidly decreasing in the 3 seconds before the collision. Onboard footage showed the aircraft holding a stable heading. Analysis sensor data on which the AHRS data is based identified that this error was likely due to the Kalman filter attempting to smooth the abrupt turn that was completed by XH9 immediately after the collision. The ATSB attempted to calculate the actual heading based on the sensor values but was not able to do so reliably without the mathematical formula that the filter used. Based on the video footage it was elected to hold the heading value for these last 3 seconds. This synchronised the onboard footage with the animation.
Figure 38 also shows a smaller rapid change in the heading of XKQ immediately after the collision. A review of the video and onboard data indicated that, unlike XH9, the change had not impacted earlier data. Subsequently the heading value from 1 second before the collision was maintained through the collision.
Figure 39 shows the corrected heading values that were used for further analysis of the aircraft positions and visibility for the pilots of the 2 aircraft.
Figure 39: Aircraft heading
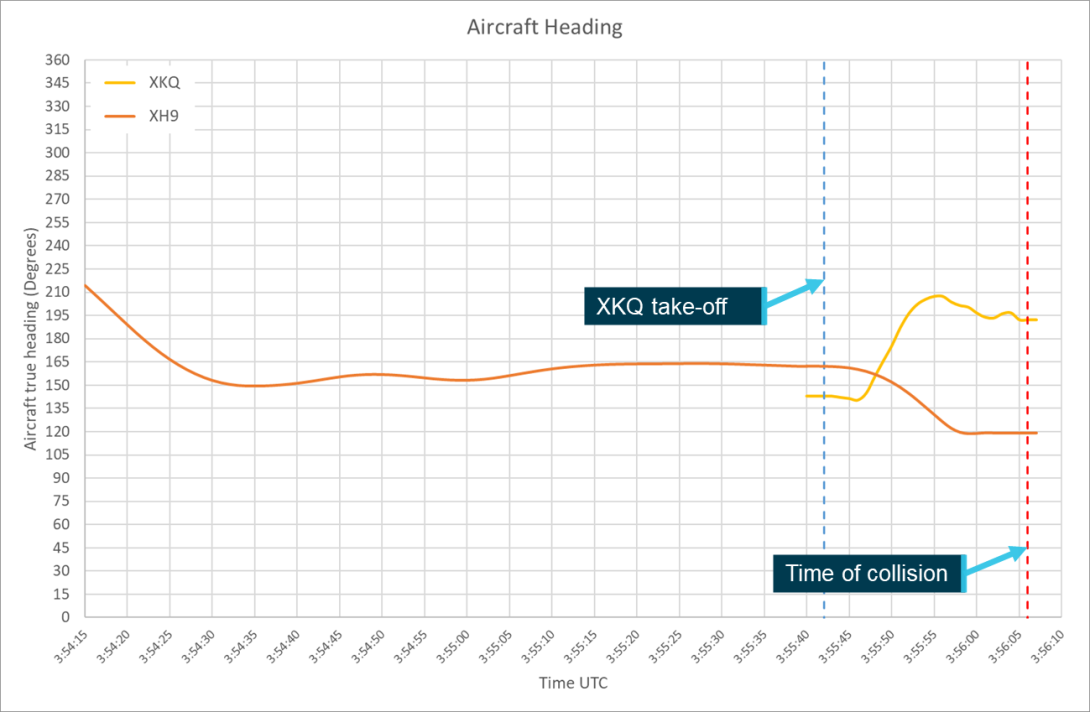
Source: ATSB
Cockpit visibility
The aircraft position and orientation parameters allow for the calculation of the relative position of each aircraft (the target) from the position of the pilot in the other (viewer) aircraft. The relative position along with the dimensions of the aircraft allow for the calculation of the observed size of the target aircraft from the viewer. The following sections will present the analysis and results for the calculation of these 2 parameters.
Throughout this section, the relative position of the target aircraft and sun at 1‑second intervals through the 111 seconds leading up to the collision is represented by a series of coloured dots. These dots progress from blue through green and to red in accordance with the timescale shown in Figure 40. These dots represent the aircrafts’ relative position and are not representative of aircraft visual angle that the aircraft spanned. The relevant plots for size should be consulted for a complete picture of both the relevant position and size at a point in time. To assist in cross reference a bar with the same colour progression has been placed over the time axis of the relevant aircraft visual angle and target shielding charts.
Figure 40: Exemplar timescale and colour bar
Source: ATSB
Aircraft visual size
Even if unshielded from the viewpoint of the pilot the aircraft must be large enough to be detected. Based on the position and orientation of each aircraft and the dimensions obtained from the aircraft’s maintenance manual, azimuth and elevation angles were calculated to 5 different points at the extremities of the aircraft fuselage These were the:
- aircraft nose
- aircraft tail
- centre of the fuselage
- forward outer tips of the 2 horizontal stabilisers.
The visual angle spanned by each aircraft in both azimuth and elevation was calculated by subtracting the maximum from the minimum value across these points. This dimension will represent the largest axis of the aircraft presented to the viewer which as discussed in Object perception will be the determining factor on detectability of the aircraft. It does not represent the area that is presented to viewer which may improve the detectability of the aircraft.
XH9
Figure 41 plots the visual angle XKQ spanned from the pilot’s eye position in XH9. XKQ crossed the likely minimum visual detection threshold of 0.2° at 03:55:25 17 seconds before XKQ departed the pad and the likely visual detection threshold 0.4° 16 seconds later. Supporting that the pilot of XH9 observed XKQ on the pad ready to depart with the doors closed.
Following XKQ’s departure from the pad the visual angle spanned increases rapidly (from 0.7° to 2.2°), then slowed and remained constant (at 2.2°) while XKQ and XH9 maintained similar tracks along the Broadwater between 15 and 11 seconds before the collision (03:55:51 and 03:55:55). As XH9 commenced its turn towards the heliport pads and the flight paths transition from parallel to perpendicular, the visual angle XKQ spanned rapidly increased until the time of collision.
Figure 41: Plot of visual angle XKQ spanned from the pilot's position in XH9
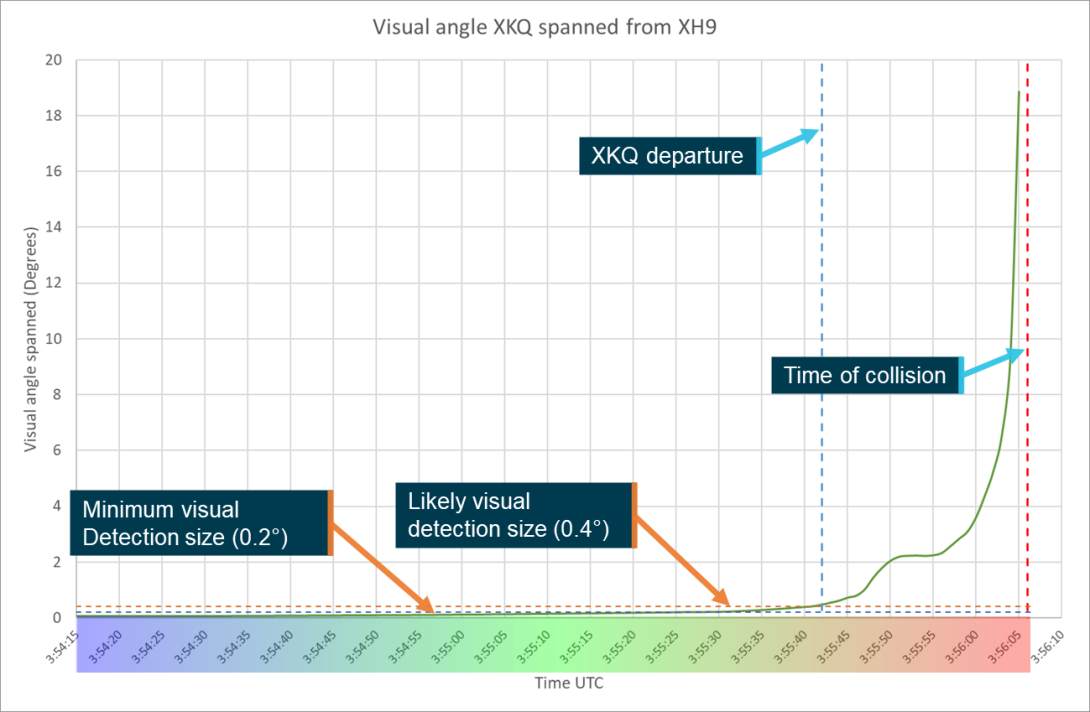
Note: Colour scale overlain on the time axis corresponds to the colourisation of the points used in Aircraft observed position section. Source: ATSB
XKQ
Figure 42 plots the visual angle XH9 spanned from the pilot’s position in XKQ. XH9 crossed the likely minimum visual detection threshold of 0.2° at 03:55:25 17 seconds before XKQ departed the pad and the likely visual detection threshold 0.4° 9 seconds later. Like XH9 it shows a very slow increase in visual angle spanned until just before XKQ departed the park pad. Following XKQ’s departure there is a constant increase until approximately 11 seconds before the collision (03:55:55) when the size rapidly increased corresponding with the transition from parallel to perpendicular flight paths.
Figure 42: Plot of visual angle XH9 spanned from the pilot's position of XKQ
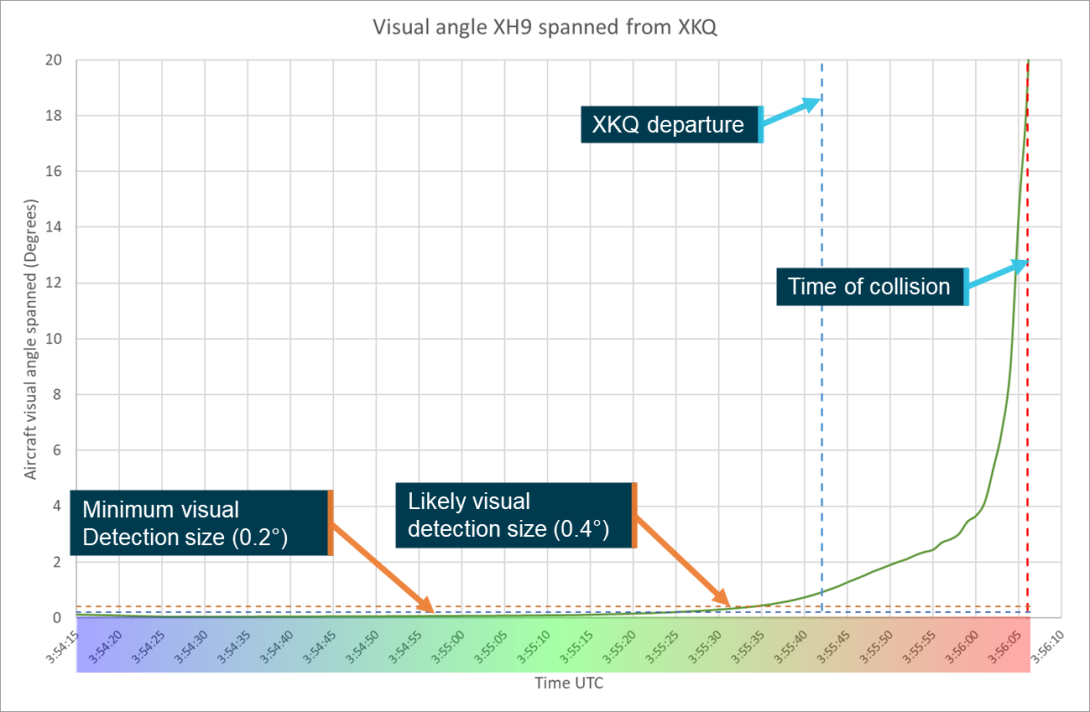
Note: Colour scale overlain on the time axis corresponds to the colourisation of the points used in Aircraft observed position section. Source: ATSB
Aircraft observed position
As outlined in Locating the Target Aircraft the target aircraft’s relative position can be represented as azimuth and elevation angles. These points represent where the target aircraft would have appeared on the spherical representation around the viewer pilot’s eye position. Overlaying these positions with the cockpit mask developed from the pilot’s eye position identifies when the target aircraft would have been shielded by the cockpit structure. This is represented by the grey shading in the figures below.
The following sections present the relative locations of the target aircraft through the 111 seconds before collision (03:54:15 to 03:56:06), from the pilots’ eye positions (estimated from onboard video analysis as discussed in Pilot eye position) and relative to the cockpit mask. Discussion of the implications of the shielding provided by the cockpit mask will be presented in Target shielding. The below analysis assumes the pilot is looking straight ahead. Consideration of differences with head and eye movement is represented in the Sensitivity analysis.
XH9
From the view of XH9’s pilot the target aircraft (XKQ) started high and to the left relative to the pilot’s eye position. It progressed down and towards the centre remaining relatively stationary as XH9 tracked along the Broadwater. As XH9 closed on the position of the park pad and passed behind XKQ the target moved to a relative position on the left and below the centre of the visual field. At the time that XKQ lifted off the pad it was approximately 10 degrees from the left cockpit pillar in the pilot’s field of view. Approximately 3 seconds later, while XKQ was still over the pad it transitioned behind the left cockpit pillar of XH9.
Figure 43 shows the relative positions at 1‑second intervals of the target aircraft from the eye position of the pilot of the viewing aircraft for the final 111 seconds leading up to the collision. Figure 44 plots these same positions showing them relative to the cockpit structure, where the points overlay the cockpit structure the aircraft will be shielded relative to the pilot, refer to Target shielding for further discussion. The second data set shown on the chart is the position of the sun relative to the aircraft (refer to Environment in Aircraft conspicuity and detectability for further detail).
The distances between the points represents the angular speed of the aircraft over time. The further apart these points the greater the angular speed and subsequently relative movement. Over the final few seconds with a smaller separation distance the relative position increases more quickly leading to the significant change seen between the final 2 points. This is discussed further in the Relative movement section.
Figure 43: Relative position of XKQ from XH9 Pilot
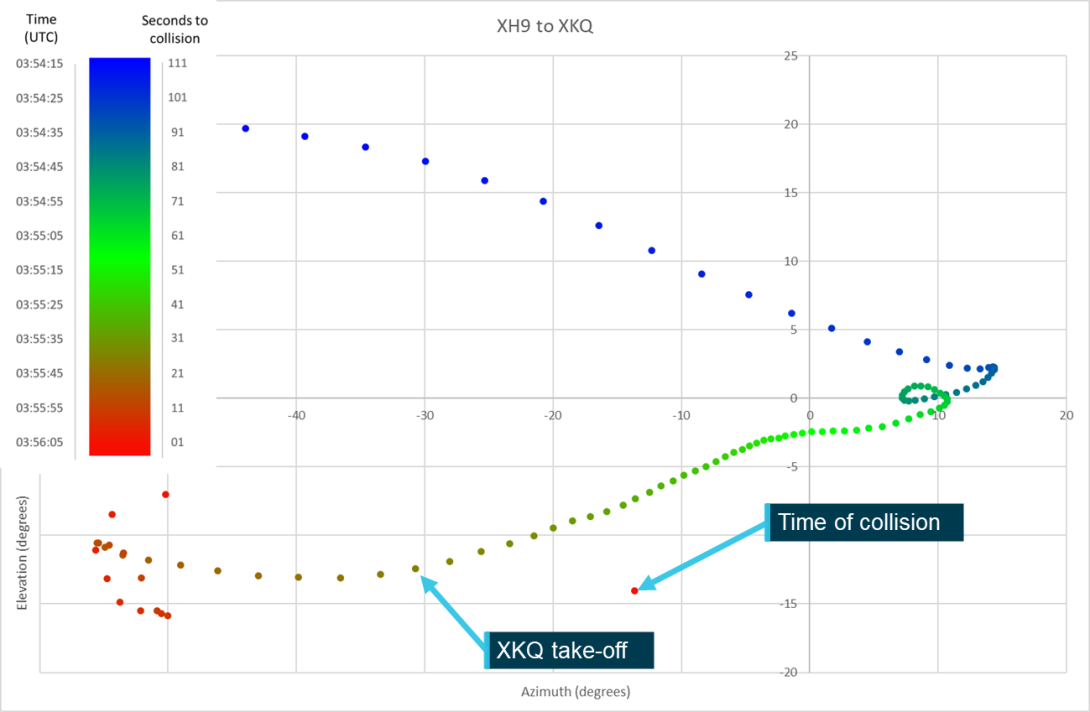
Source: ATSB
Figure 44: Relative position of XKQ from XH9 overlaid on pilot’s view
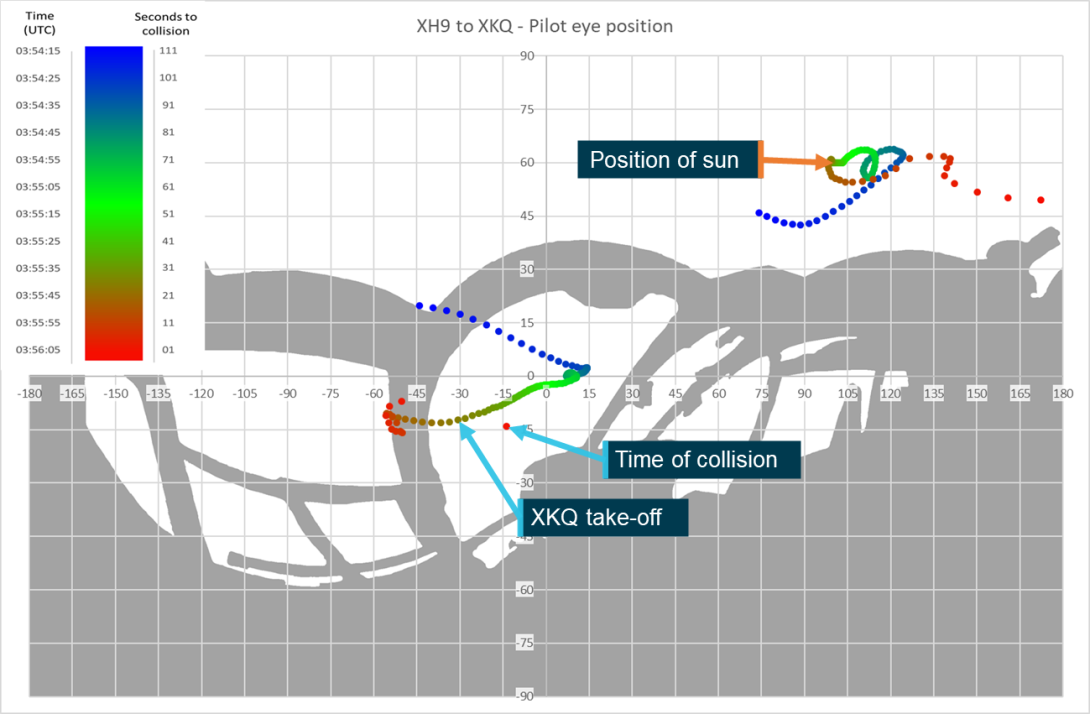
Source: ATSB
Heliport
As part of this analysis, the ATSB also assessed the relative location between XH9 and the pilot’s aiming point, pad 3 of the operator’s heliport, and the vessel that the pilot had identified that they were planning to pass behind on their approach. The relative positions of the pad and vessel have been plotted independently and images from the animation used to show the relative positions throughout the lead‑up to the accident.
During the initial phase of the final 111 seconds leading up to the collision the relative positions of the heliport and XKQ to the pilot of XH9 were similar. This is due to the comparatively short distance (220 m) between the park and heliport pads along XH9’s intended route. As XH9 approached and then passed the park pad, the heliport remained within the windscreen in front of the pilot while the position of XKQ continued traversing to the left. Figure 45 shows the relative position of heliport pad 3 that XH9 was aiming for came to the centre of the pilot’s view as they completed the turn to line up the pad for their final approach. In the final seconds leading up to the collision the relative position of the pad moved up relative to the pilot’s eye position corresponding to the slight nose down pitch recorded.
Figure 45: Relative positions of Heliport pad 3 overlain on pilot’s view
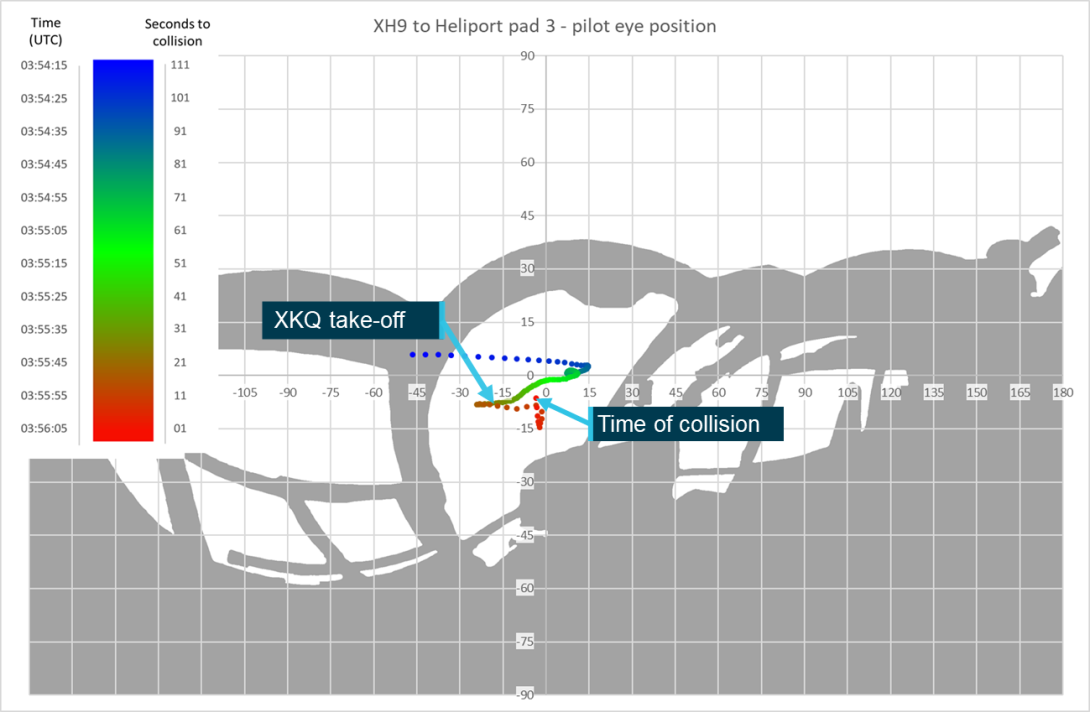
Source: ATSB
Vessel
Figure 46 plots the relative position of the vessel from the pilot of XH9, based on the interpolated 1‑second data from 03:55:44 until 03:56:00. The data shows the vessel tracking ahead of XH9 and slightly to left. As XH9 turned to commence its final approach the vessel tracked to the right being shielded by the instrument panel coaming approximately 10 seconds before the collision.
Figure 46: Relative positions of the vessel overlain on pilot’s view
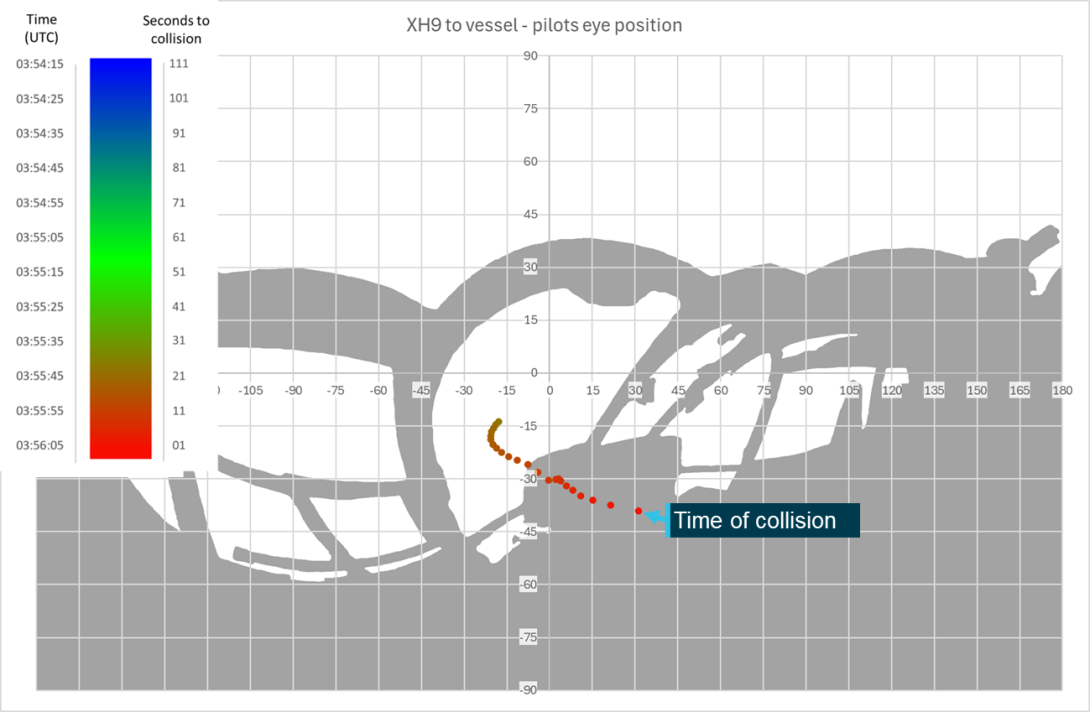
Source: ATSB
Relative positions
Figure 47, Figure 48, Figure 49 and Figure 50 shows the relative positions, looking ahead from the pilot’s eye position of XH9, of all 3 elements discussed through this section, XKQ, heliport pad 3 and the vessel. The figures, taken from the animation developed in collaboration between the ATSB and IWI, show the relative positions at 4 points through the sequence.
- 03:55:44, 22 seconds before collision and 2 seconds after XKQ has lifted off the park pad
- 03:55:53, 13 seconds before the collision and the middle of the time period where XKQ was visible outside the left cockpit pillar of XH9
- 03:55:56, as the vessel passes behind the instrument panel coaming
- 03:56:00, start of limiting window for time to react and manoeuvre.
Figure 47: Relative positions of Heliport pad 3, vessel and XKQ at 03:55:44
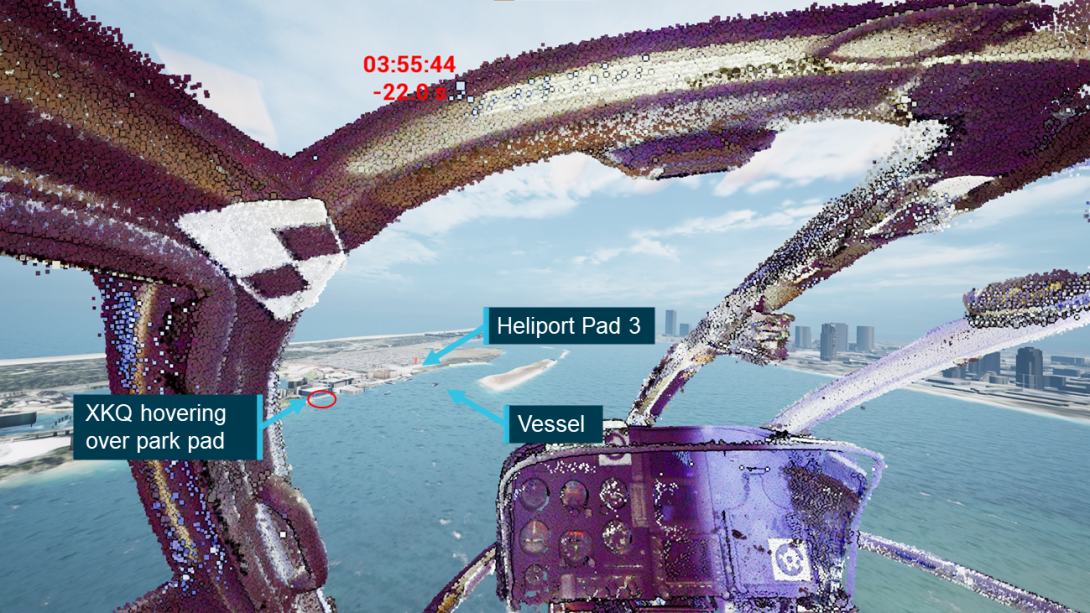
Source: IWI, annotated by the ATSB
Figure 48: Relative positions of Heliport pad 3, pleasure craft and XKQ at 03:55:53
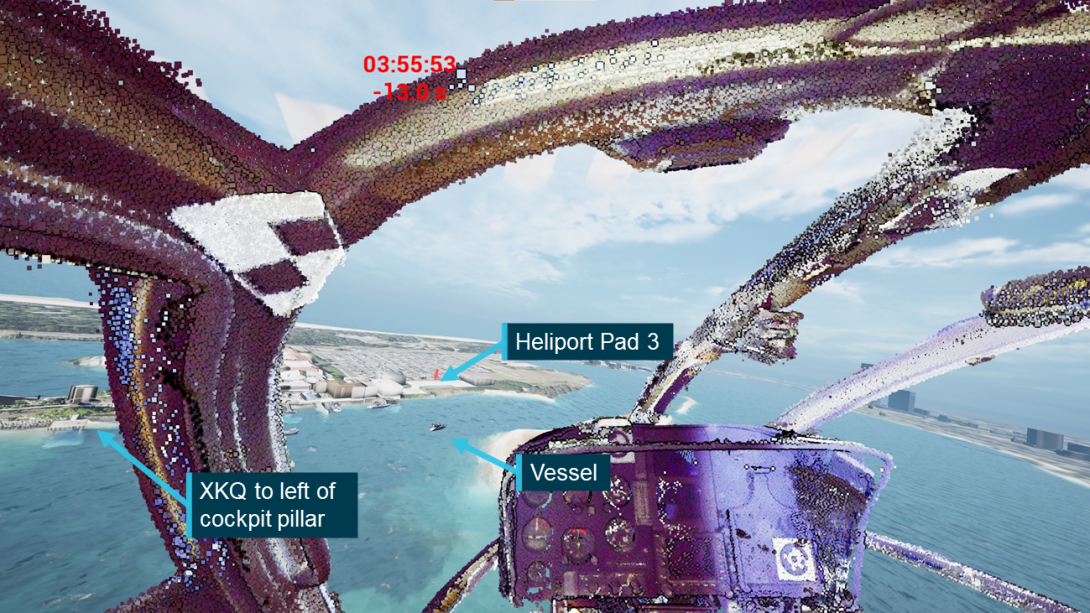
Source: IWI, annotated by the ATSB
Figure 49: Relative positions of Heliport Pad 3, pleasure craft and XKQ at 03:55:56

Source: IWI, annotated by the ATSB
Figure 50: Relative positions of Heliport pad 3, vessel and XKQ at 03:56:00
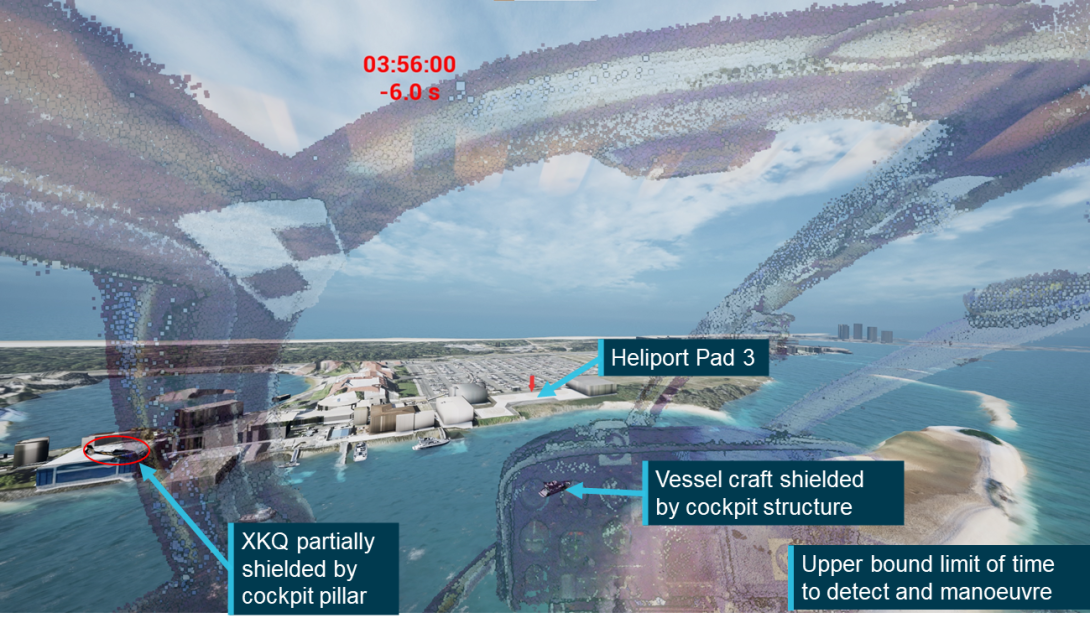
Note: Simulation image appears to show approximately half of XKQ as unshielded variation between ATSB analysis and the simulation is discussed in the animation development section. Source: IWI, annotated by the ATSB
XKQ
The positioning of XKQ’s nose towards the south-east corner of the park pad means that XH9’s initial relative position was to the rear left of XKQ. XH9 then tracked across behind XKQ before coming down the right side of the aircraft and above the roof line relative to the pilot’s eye position.
Figure 51 shows the relative positions of the target aircraft (XH9) from the pilot’s eye position of the viewer aircraft (XKQ). Figure 52 plots these positions relative to the cockpit structure, refer to Target shielding for further assessment. The second data set, in Figure 52 is the position of the sun relative to the aircraft (refer to Environment in Aircraft conspicuity and detectability for further detail).
Figure 51: Relative position of XH9 from XKQ pilot
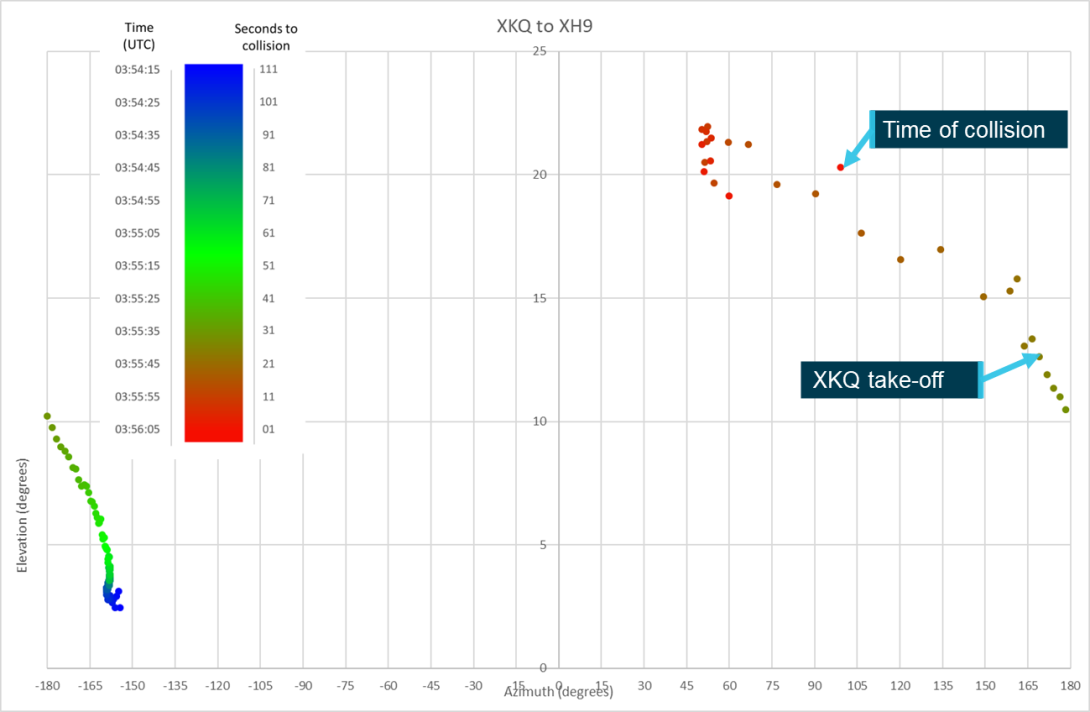
Source: ATSB
Figure 52: Relative position of XH9 from XKQ overlaid on pilot’s view
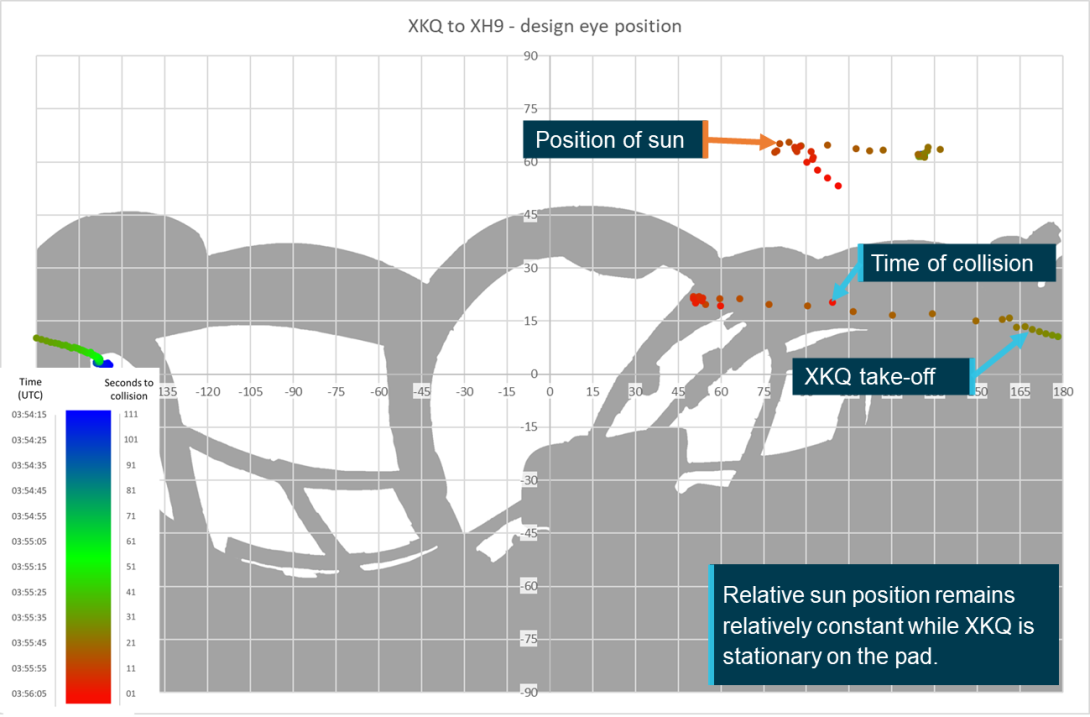
Source: ATSB
XKQ pilot cap
As outlined in the Pilot information section the pilot of XKQ was wearing a Sea World Helicopters ‘trucker’ style cap for the flight. To assess the impact of the cap on the visibility of the target aircraft the front edge of the estimated cap brim was placed over the representation from the pilot’s viewpoint; anything above the outlined cap brim, shown in Figure 53, would be shielded from the pilot.
As shown in Figure 53 the relative position of the XH9 passes behind the peak of the cap between 03:55:50 and 03:55:51, between this time and the collision XH9 was shielded by cockpit structure. Subsequently, from the DEP, the pilot’s cap will have no impact on detectability of the target aircraft. A further discussion looking at the impacts of the pilot’s cap in an alternate scenario where the aircraft is visible is provided in the Sensitivity analysis. A discussion of the impacts and importance of the pilot’s cap in reducing the impacts of the sun is presented in the Sun position section of Aircraft conspicuity and detectability.
Figure 53: Relative position of XH9 from XKQ overlaid with shielding of pilot’s cap
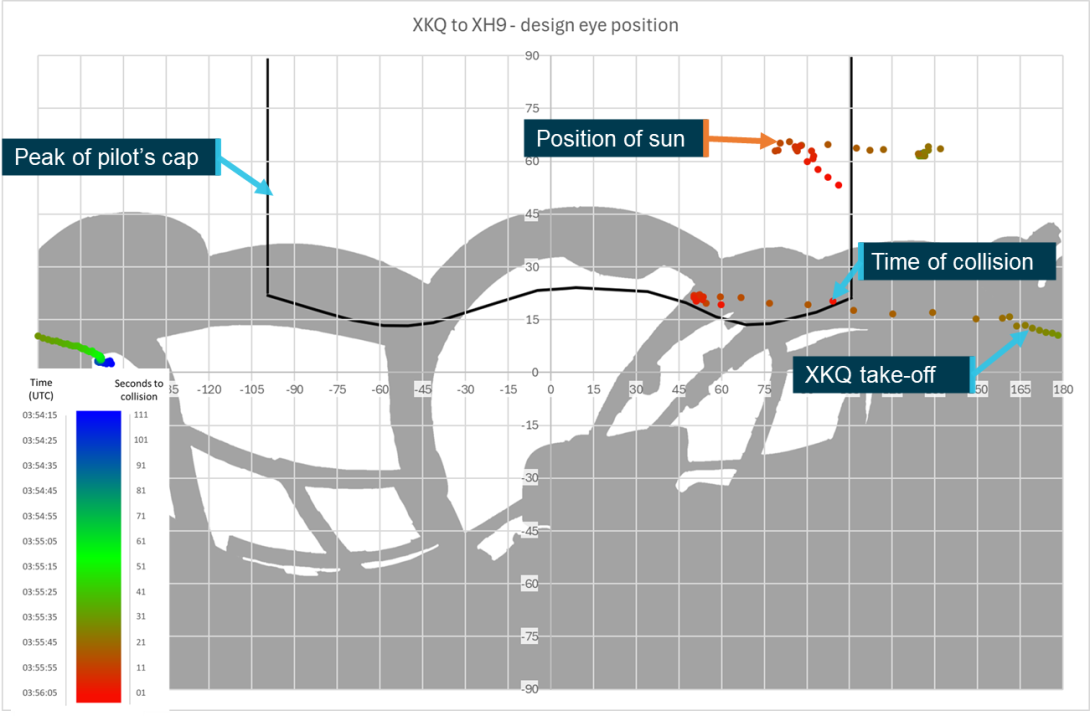
Source: ATSB
At the times that the target aircraft position overlies the aircraft structure in the diagrams presented above, the target aircraft will be obstructed from the eye position of the pilot of the viewer aircraft. Based on the aircraft position information presented in Figure 44 and Figure 52 the ATSB assessed when the target aircraft would have been shielded from the pilot of the viewer aircraft.
XH9
For the majority of the final 111 seconds before the collision, XKQ was visible to the pilot of XH9. The ATSB analysis determined that XKQ was likely shielded briefly at the start of the study window for 3 seconds of 03:54:17–19. However as discussed in Aircraft visual size, at this time XKQ would have likely been too small to be reliably detected by the pilot. Following this XKQ was unobstructed until 03:55:45 (3 seconds after XKQ departs the park pad) when it transitioned behind the left cockpit pillar. This corresponds with the pilot’s report that they had sighted XKQ on the pad during their transit down the Broadwater and had observed the doors being closed following the loading of passengers. XKQ was then obstructed for 5 seconds re-emerging on the left of the cockpit pillar at 03:55:51 for a further 3 seconds before being shielded again from 03:55:54 until 03:56:00, partially shielded at 03:56:01 and unshielded from 03:56:02, 4 seconds before the collision and at the limit of time required for an urgent response as discussed in Reaction time.
Figure 54 shows the times that XKQ would have been obstructed from the view of the pilot of XH9. These times are overlain on the visual angle XKQ spanned showing the times when the aircraft was a detectable size and unobstructed.
Figure 54: Target aircraft obstruction periods pilot of XH9
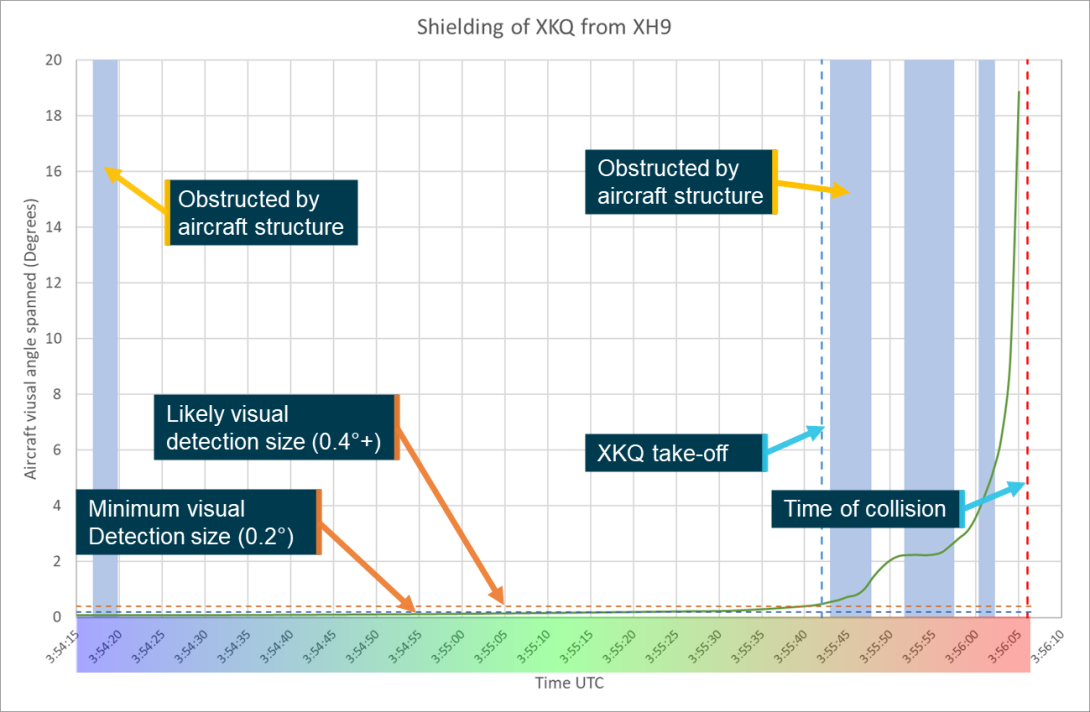
Note: Colour scale overlain on the time axis corresponds to the colourisation of the points used in Aircraft observed position section. Source: ATSB
XKQ
The ATSB analysis identified that XH9 was likely unobstructed through the rear left window of XKQ until 03:55:12, at a position as shown in Figure 52, approximately 150° from centre of the view. This does not consider the effect on structural and other obscuration of loading passengers, which was completed at 03:55:07. The effect of loading may include the movement of persons, opening or closing of doors which may obstruct the pilot’s sight lines. Additionally, during the loading of passengers, the pilot’s attention is likely to be directed to other tasks and not seeking to detect aircraft in their vicinity (refer to the investigation report for further detail and discussion of this aspect). At the time XKQ lifted from the pad, XH9 is positioned almost directly behind it. During the departure XKQ rotated towards the south which increased the speed of XH9’s transition down the right of the aircraft relative to the pilot’s position. XH9‘s trajectory aligned with the position of the overhead panel and then the centre left cockpit pillar shielding it from view until the collision.
Figure 55 shows the times that XH9 would have been shielded from the view of the pilot of XKQ by the aircraft structure. These times are overlain on the visual angle XH9 spanned showing that based on the ATSB’s analysis there was no time that XH9 would have been of a detectable size and unshielded from the pilot of XKQ.
Figure 55: Target aircraft obstruction periods pilot of XKQ
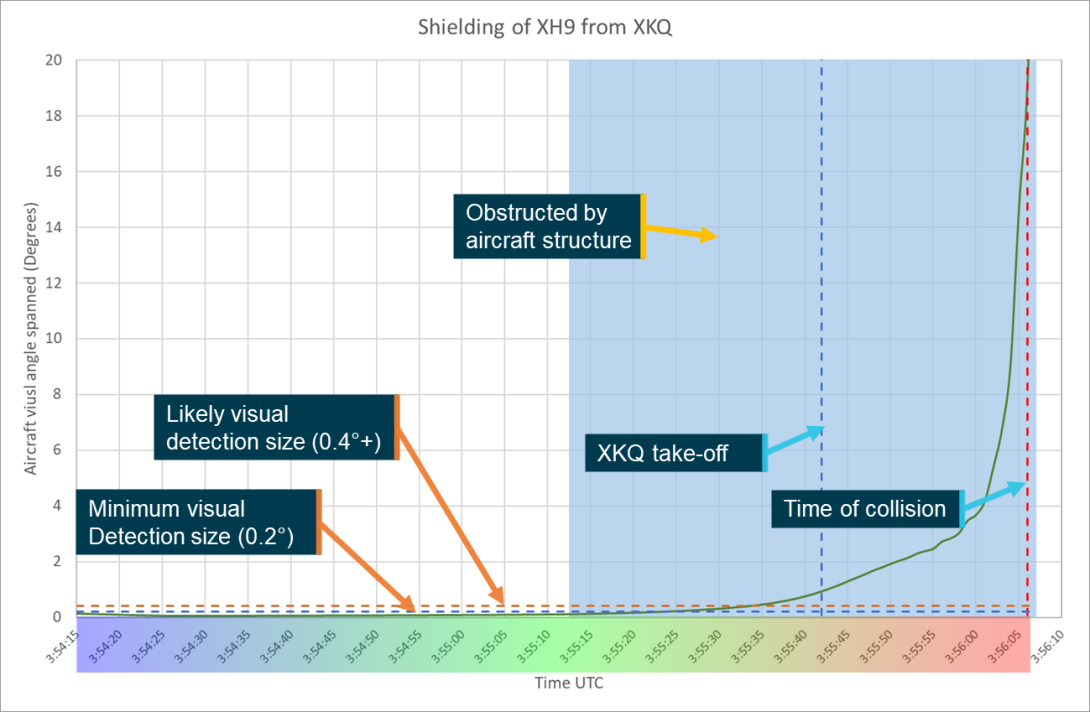
Note: Colour scale overlain on the time axis corresponds to the colourisation of the points used in Aircraft observed position section. Source: ATSB
Field of view analysis
Until this point, the analysis has considered a full spherical representation of the view around the pilot’s head. However, as outlined in the Field of View section, humans can only observe a limited portion of this sphere at any point in time and where a target/stimulus appears within this area will affect the opportunity for it to be detected. The ATSB analysis, which idealised the FOV as rectangular, placed the 3 areas of the FOV, foveal, inner and full, over the diagrams showing the positions of both the target aircraft and the cockpit structure, using these to assess where the target aircraft would have appeared and get a better understanding of the opportunity for detection.
XH9
Figure 56 shows the plot of the areas of the pilot’s FOV overlaid on the cockpit structure and the positions of the target aircraft (XKQ) for a situation where the pilot was looking directly ahead. The data shows that the target aircraft would have traversed across the pilot’s FOV during the final 111 seconds. Importantly in the lead‑up to the collision XKQ traversed across just below the lower edge of the foveal region of highest visual acuity before passing out through the inner visual field and into the outer visual field. This corresponds with the pilot’s report that they were able to identify XKQ on the pad as they came down the Broadwater.
At the time that XKQ lifted from the park pad it appeared on the boundary of the inner and outer visual field to the pilot of XH9, subsequently they would have been less likely to visually detect any change in the status of the target aircraft. To support detection of the aircraft’s status change would have required something to specifically draw the pilot’s attention such as a significant change in contrast or lighting. The chart also identifies that the sun position was proximal to the upper right corner of the pilot’s visual field, based on the ATSB’s rectangular model. Where the sun is near the edge of the pilot’s visual field this can cause glare or be directly in pilots’ eyes limiting their ability to detect threats.
Figure 56: XH9 pilot FOV analysis
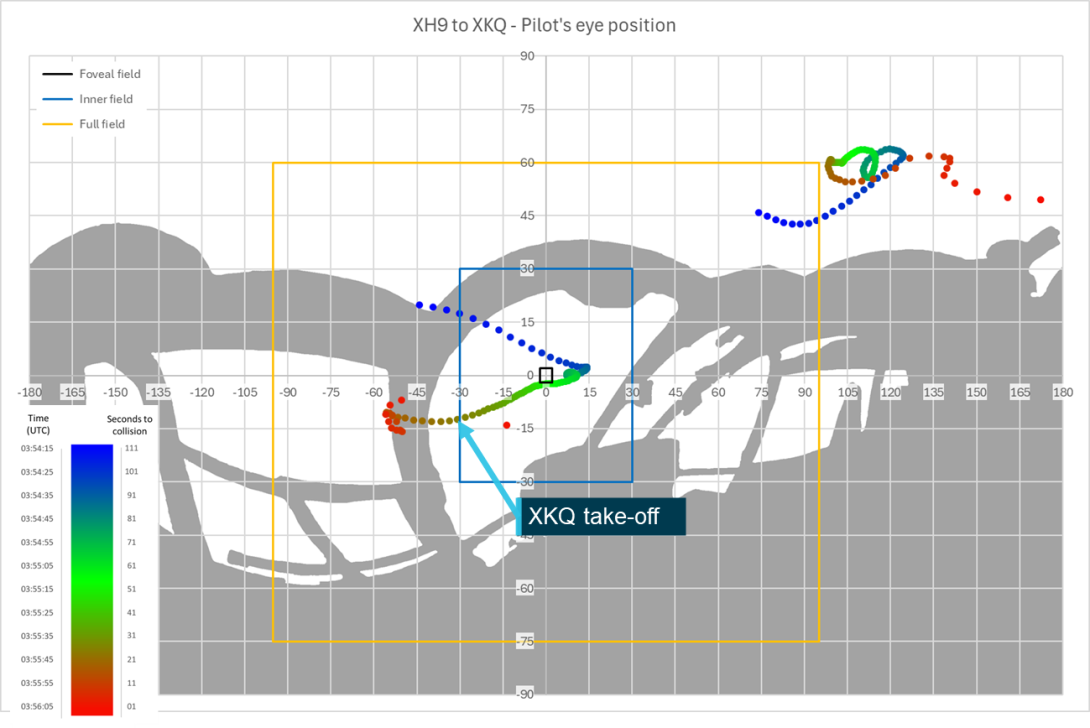
Source: ATSB
XKQ
As XH9 remained shielded from the view of the pilot of XKQ the assessment of where it sat in the field of view is not relevant.
Assessment of alternate rotations of the pilot’s head and eyes will be presented in the sensitivity analysis.
Sensitivity analysis
Both the Target Shielding and Field of View analysis conducted in the sections above are based on a stationary head position with the pilot’s eyes directed straight ahead. This is not representative of a real-world environment where the pilot is free, and encouraged, to move their head and eyes to be able to identify threats and developing situations such as approaching aircraft. The sensitivity analysis demonstrates the impacts of various head and eye movements on the opportunity for detection. In this analysis head and eye rotations have been considered independently to allow for independent assessment of their impact. However, as movement of the head and eyes usually interact the impacts presented here will likely compound.
As the pilot’s eye position, cockpit structure and target aircraft position are relative to one another, the sensitivity analysis is also representative of variation in the actual and reported positions of the aircraft. A movement of the pilot’s eye position to the left is the equivalent of the position of the target aircraft moving to the right. Similarly, if the position of the head is moved up this is equivalent to the position of the target aircraft being moved down. For simplicity of the analysis, the discussion will be reflected as movement in the head and eye position.
Position vs rotation
Within the physical limitations of the human body, the head and eyes can be rotated independently of one another. This allows the eyes, which move with the head, to remain focused on an object of interest while the head is moved. However, the movement of the head around its axis of rotation (centre of the neck), either laterally or vertically, will change the position of the eyes. This will affect the relative positions of objects within the field of view. Discounting binocular vision considerations, which for the purpose of this study are considered negligible, the impact of a head rotation should be considered as a movement and rotation of the pilot’s eyes.
Figure 57 and Figure 58 below show highly stylised representations of a 30° rotation of either the head or eyes in the vertical plane. The diagrams demonstrate difference in position of the eyes between a rotation of the head and an independent rotation of the eyes.
Figure 57: Example of eye position displacement due to a head rotation (top down view)
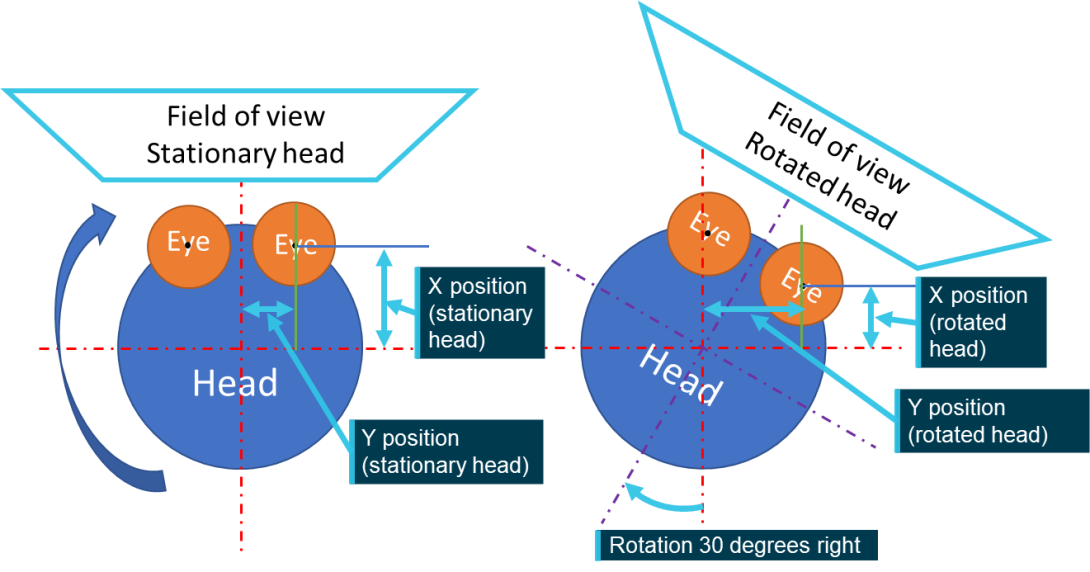
Source: ATSB
Figure 58: Field of view change due to eye rotation (top down view)
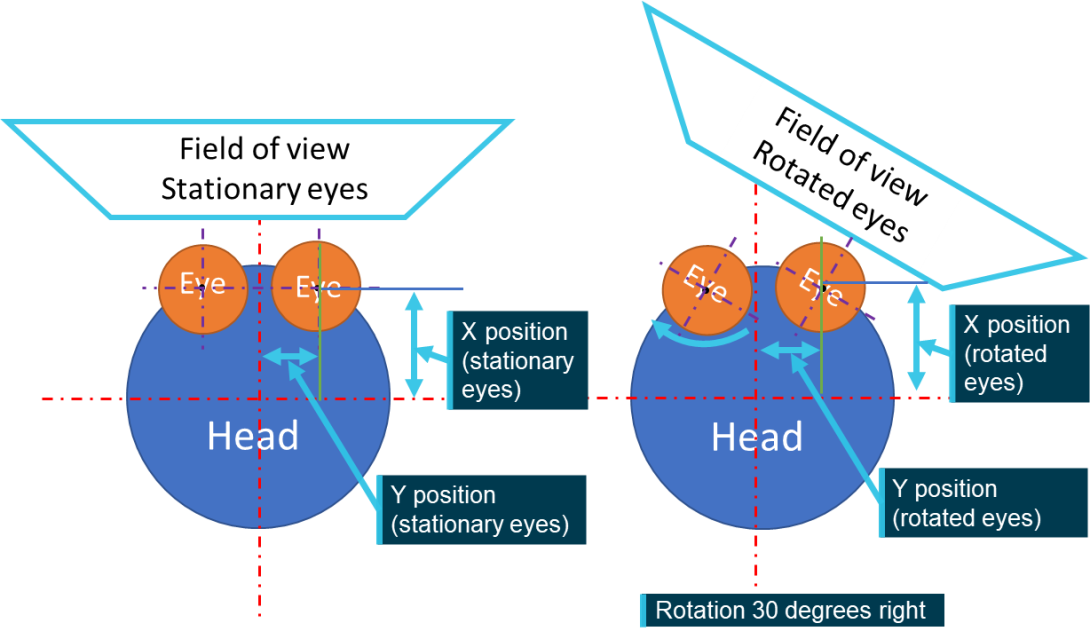
Source: ATSB
The following 2 sections present the results of analysis of movement of the pilot’s head and eyes and rotation of the eyes, a combination has not been presented due to the number of possible combinations of movement that could be applied.
Sensitivity analysis – eye position
Sensitivity analysis of the eye position considered 3 scenarios as outlined below.
- Eye position moved 30 and 50 mm to the left and right showing impact of the pilot’s head not being centred on the seat.
- The short and tall pilot eye positions.
- If the pilots of either aircraft were to lean forward by up to 500 mm (in 100 mm increments) to look for the other aircraft what impact that would have.
In the second and third scenarios, as discussed in Pilot’s eye position, the change in height or lateral (forward) location will also induce a corresponding displacement along the other axis.
For the 2 aircraft a vision map representing each head position was developed and a subsequent chart looking at the times that the target aircraft would have been shielded by the viewer aircraft’s cockpit structure. These charts are presented with a FOV with the pilot looking directly ahead for simplicity. The effect of movement of the FOV is demonstrated in the Sensitivity analysis – eye rotation section.
XH9
The positional sensitivity analysis for XH9 is presented in 4 sections.
- The first looking at movements of the head 30 and 50 mm to the left of the pilot’s eye position.
- The second 30 and 50 mm to the right of the pilot’s eye position.
- The third section will consider the taller and shorter pilot views.
- The fourth and final section will present the views moving the pilot’s head forward in 100 mm increments.
The figures showing both the vision map and the aircraft shielding for each of these movements are shown following the supporting analysis but are referenced within the text and shown in Table 3.
This analysis has been designed to support the analysis of video footage that indicated the location of the pilot’s head when it was visible to the cameras on board the aircraft. These movements of the pilot’s head were discussed in the Onboard footage section of Recorded data.
Movement left
Figure 58 and Figure 61 move the pilot’s eye position 50 and 30 mm to the left (towards the pilot’s side door). From 25 seconds before the collision (03:55:41) the target aircraft would be shielded for 8 and 9 seconds respectively, as shown in Figure 60 and Figure 62. In comparison from the pilot’s eye position, the target aircraft is shielded for 14 of the final 25 seconds.
While there is less shielded time this does not immediately equate to an increased likelihood of detection. In both cases the movement left reduces the time that the aircraft is visible within the aircraft’s windscreen after lifting off from 3 seconds at the pilot’s eye position to 2 seconds at 30 mm left and 1 second at 50 mm left. The increase in visible time is when the aircraft is outside of the left cockpit pillar in the pilot’s outer FOV, when facing forward, where detection is less likely. However, the increased visible time allows more opportunity for the pilot to be drawn to the target aircraft and the fact that it is later in the departure sequence increases the size of the aircraft in the FOV, the likelihood that it will contrast with the background against which it appears increases the opportunity for lower powered lights to draw the attention of the pilot.
Movement right
Figure 63 and Figure 65 move the pilot’s eye position 50 and 30 mm to the right (towards the front passengers) this will result in a significant increase in the shielding time of the target aircraft. The aircraft is shielded for 19 of the last 25 seconds in both cases, as shown in Figure 64 and Figure 66. The movement of the eye position to the right moves the relative position of the cockpit pillar to the left. Subsequently there is an additional 1 second where the target aircraft is not shielded before it transitions behind the pillar (03:55:46). However, the target aircraft will now not appear on the outer side of the cockpit pillar, remaining shielded until approximately 1 second before the collision when it becomes large enough to exceed the width of the cockpit pillar and will simultaneously appear on both sides of the pillar.
Pilot height
As discussed in the Pilot eye position section, the eye point of the pilot of XH9 was determined to be above the design eye position for the aircraft. Subsequently, the variation between the pilot’s eye point and the 75th percentile eye position will be lower compared to the design eye position. Conversely, the variation between the pilot’s eye position and 25th percentile eye position is expected to be greater.
The curved shape of the cockpit structure means that as the pilot’s head is moved up or down the shielding will be altered. The movement of the pilot’s eye position up to represent a 75th percentile pilot, as shown in Figure 67, will replicate the effect of moving the pilot’s eye position 50 mm to the left from the pilot’s eye position, with a reduction in target shielding, as shown in Figure 68, with the increased visible time outside of the cockpit pillar.
The movement down for a 25th percentile pilot, as shown in Figure 69, will be the equivalent of a movement 50 mm to the right. As shown in Figure 70 there will be an increase, by 1 second, in the time that the aircraft is not shielded prior to transition through to the cockpit pillar but once shielded by the pillar it will not be unshielded again until 1 second before the collision limiting opportunity for detection.
Movement forward
The ATSB sought to determine how far forward the pilot would have had to lean to make the target aircraft visible through the cockpit windscreen. Five alternate positions were considered moving the head position forward by 100 mm each time and making corresponding vertical position shift assuming that the pilot was leaning forward pivoting from their hips with their restraint correctly fitted low and tight around their hips.
It was determined that a movement between 100 mm forward, as shown in Figure 71 and Figure 72, and 200 mm forward, as shown in Figure 73 and Figure 74, would remove the shielding obstruction from the cockpit structure and give the pilot an unobstructed view of the target aircraft. This lack of obstruction gives the viewer pilot a maximum opportunity to detect the target aircraft. as the size increases and contrast changes as it transits towards them. The movement of the pilot’s head forward will not impact the FOV. Subsequently, if the pilot continues to look directly ahead the target aircraft will still move outside of the pilot’s inner FOV as it approaches. This means that detection still relies on the attention of the pilot being drawn to the target aircraft as it approaches to enable detection. The figures for this section only show the 100 mm and 200 mm forward movement views as beyond this point there is no further shielding to display.
Table 3: XH9 sensitivity analysis figures
| Figure Number | Movement | Magnitude (mm) | Chart type |
| Figure 59 | Left | 50 | Vision map |
| Figure 60 | Left | 50 | Shielding chart |
| Figure 61 | Left | 30 | Vision map |
| Figure 62 | Left | 30 | Shielding chart |
| Figure 63 | Right | 50 | Vision map |
| Figure 64 | Right | 50 | Shielding chart |
| Figure 65 | Right | 30 | Vision map |
| Figure 66 | Right | 30 | Shielding chart |
| Figure 67 | Tall | Vision map | |
| Figure 68 | Tall | Shielding chart | |
| Figure 69 | Short | Vision map | |
| Figure 70 | Short | Shielding chart | |
| Figure 71 | Forward | 100 | Vision map |
| Figure 72 | Forward | 100 | Shielding chart |
| Figure 73 | Forward | 200 | Vision map |
| Figure 74 | Forward | 200 | Shielding chart |
Figure 59: Sensitivity analysis head position 50 mm left
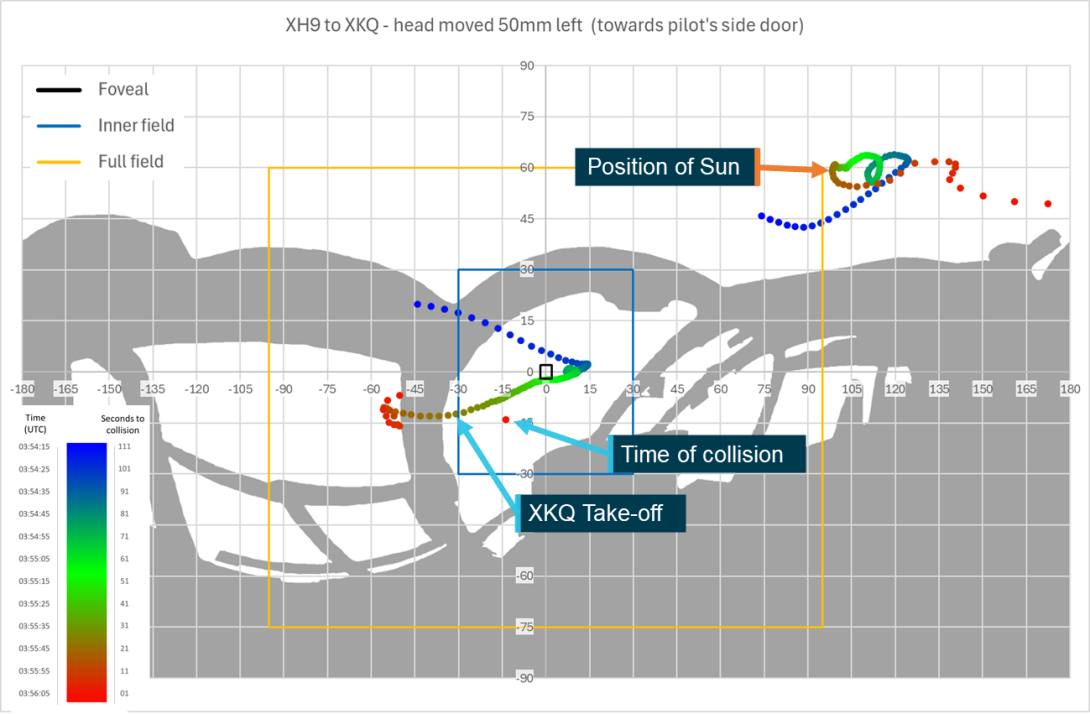
Source: ATSB
Figure 60: Sensitivity analysis head position 50 mm left shielding chart
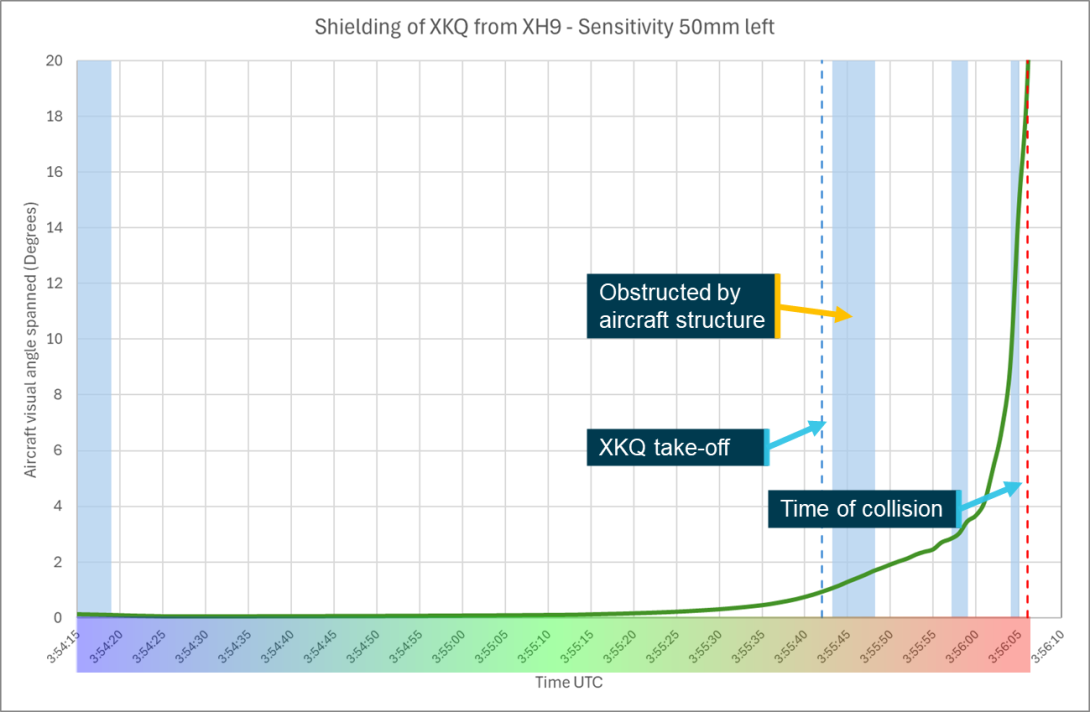
Source: ATSB
Figure 61: Sensitivity analysis head position 30 mm left
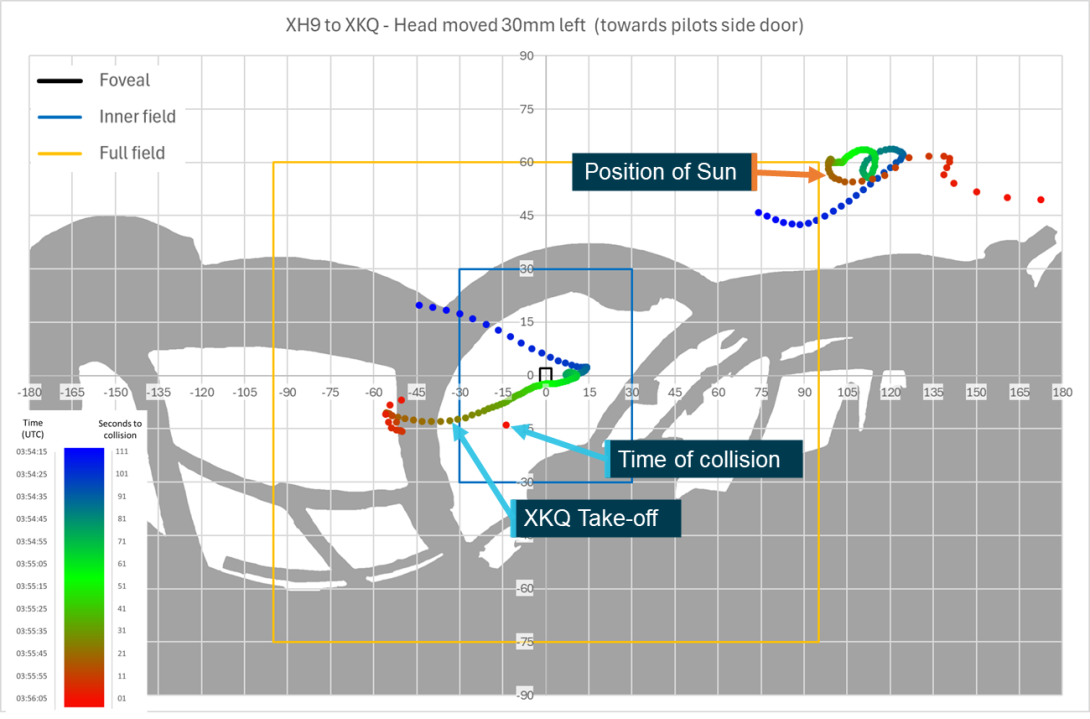
Source: ATSB
Figure 62: Sensitivity analysis head position 30 mm left shielding chart
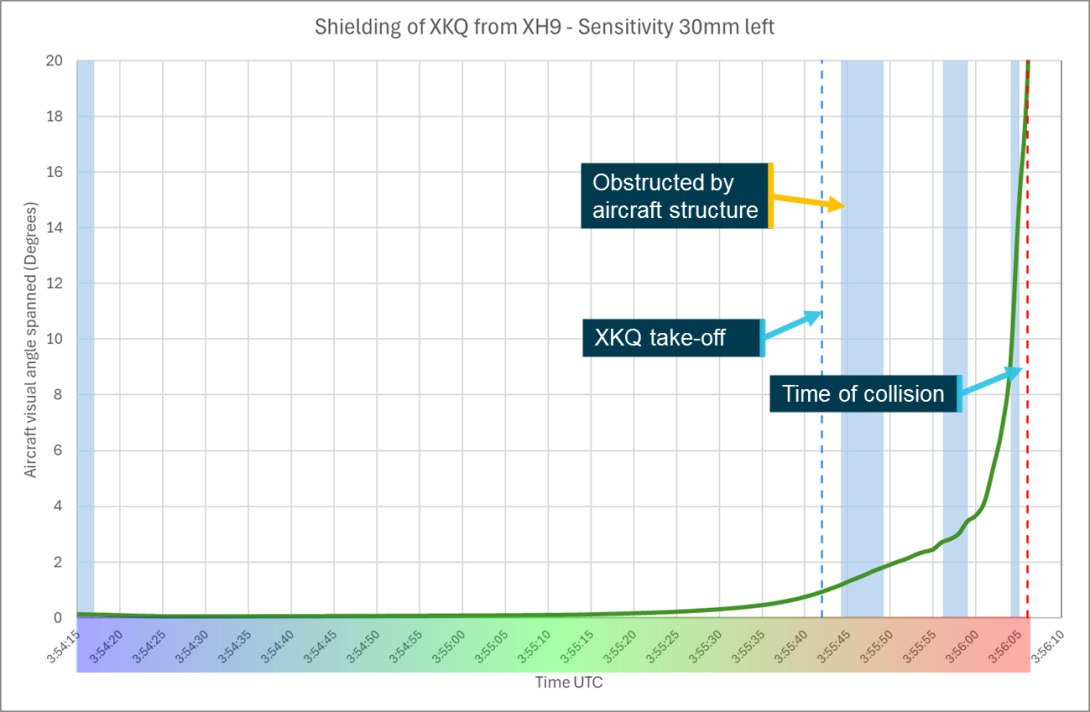
Source: ATSB
Figure 63: Sensitivity analysis head position 50 mm right
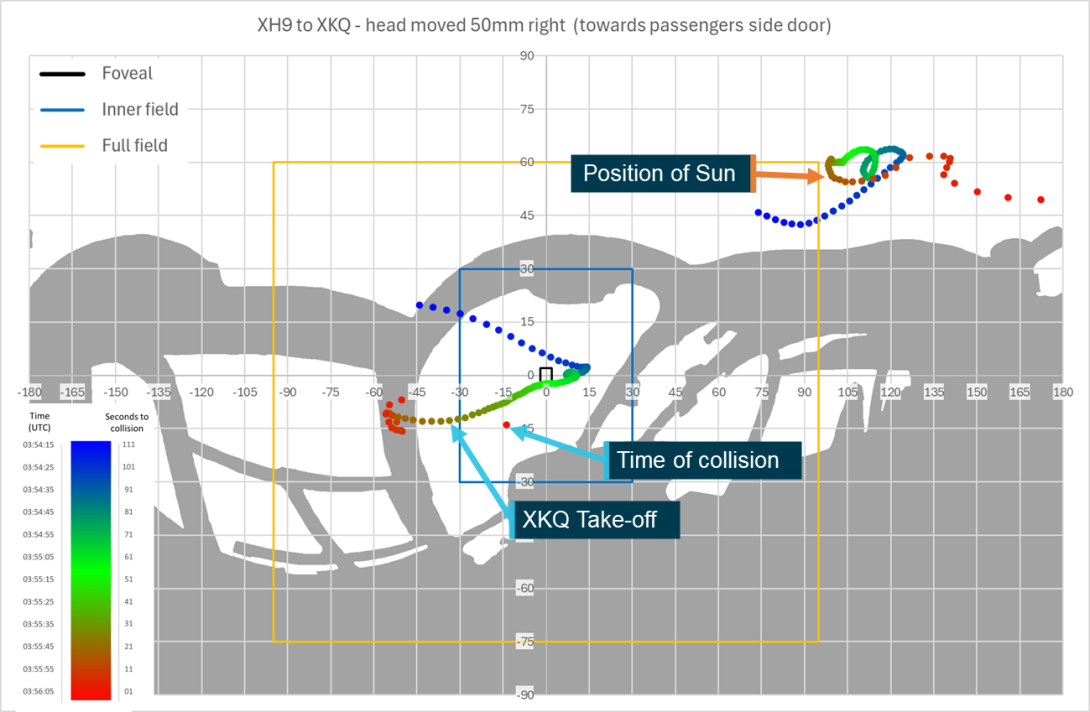
Source: ATSB
Figure 64: Sensitivity analysis head position 50 mm right shielding chart
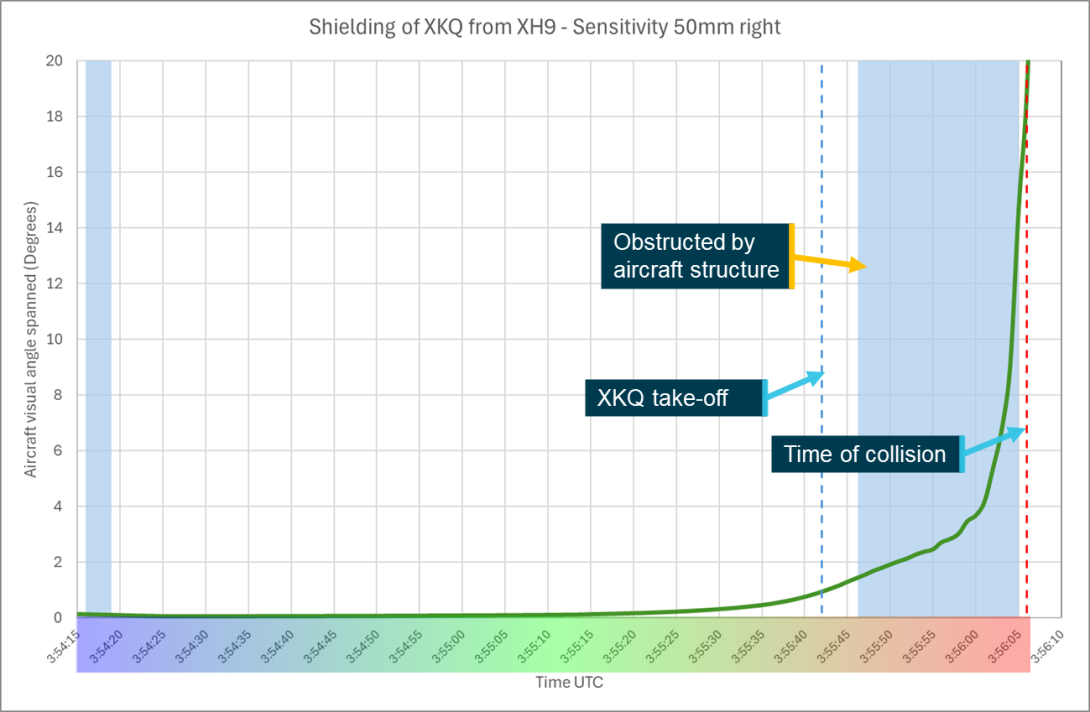
Source: ATSB
Figure 65: Sensitivity analysis head position 30 mm right
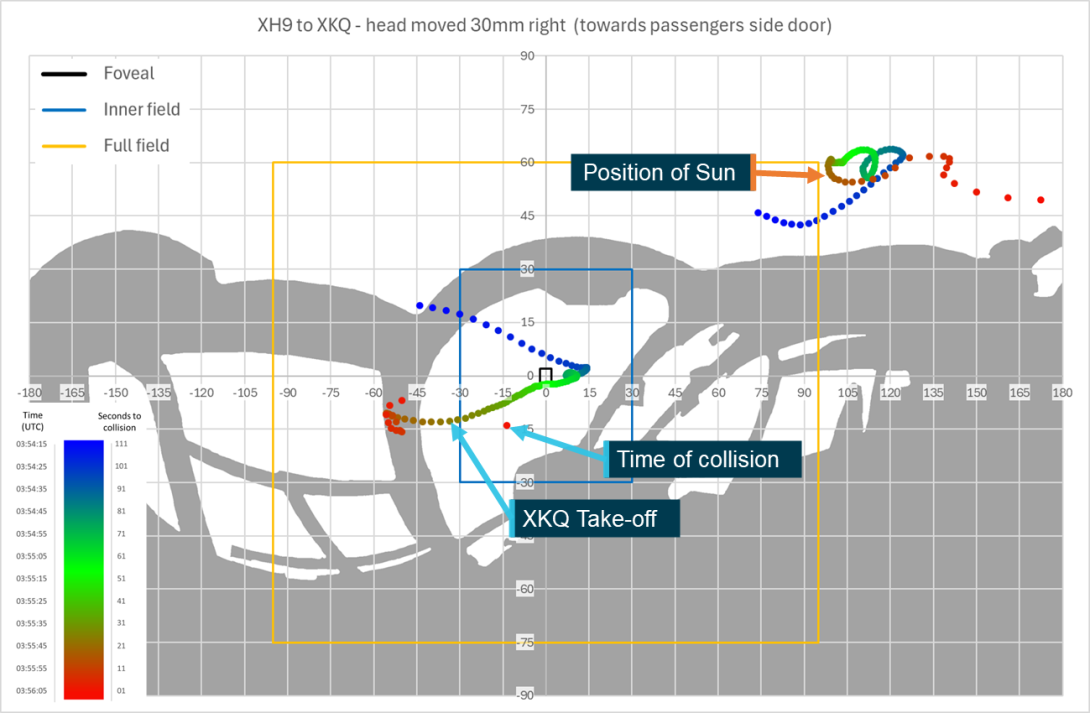
Source: ATSB
Figure 66: Sensitivity analysis head position 30 mm right shielding chart
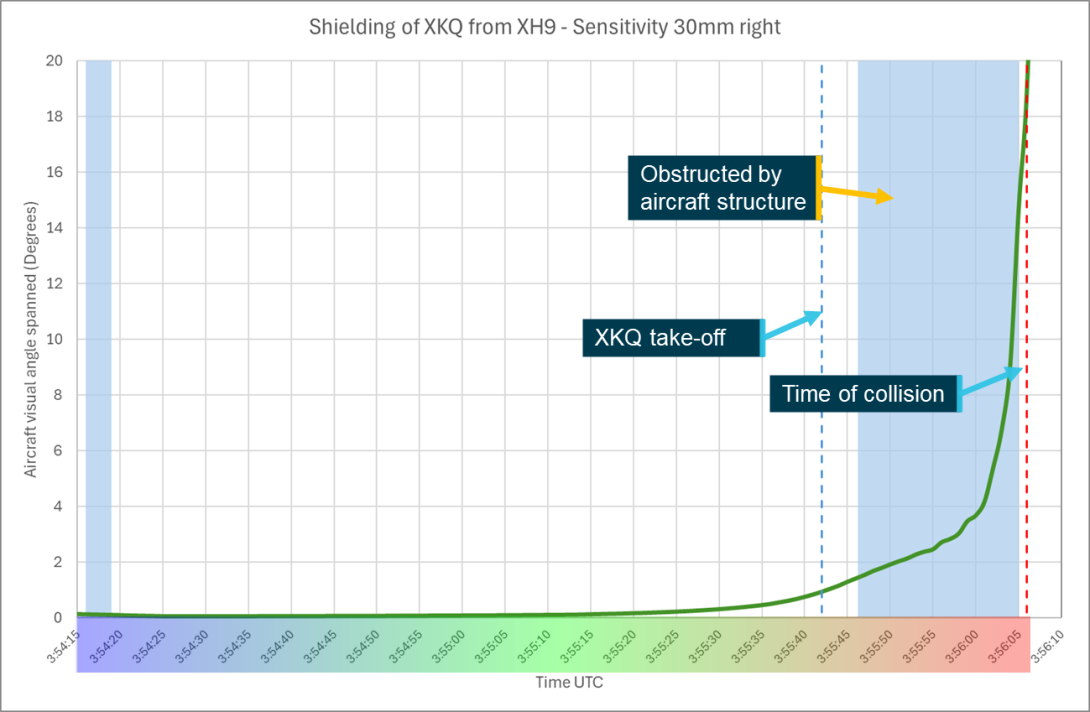
Source: ATSB
Figure 67: Sensitivity analysis tall head position
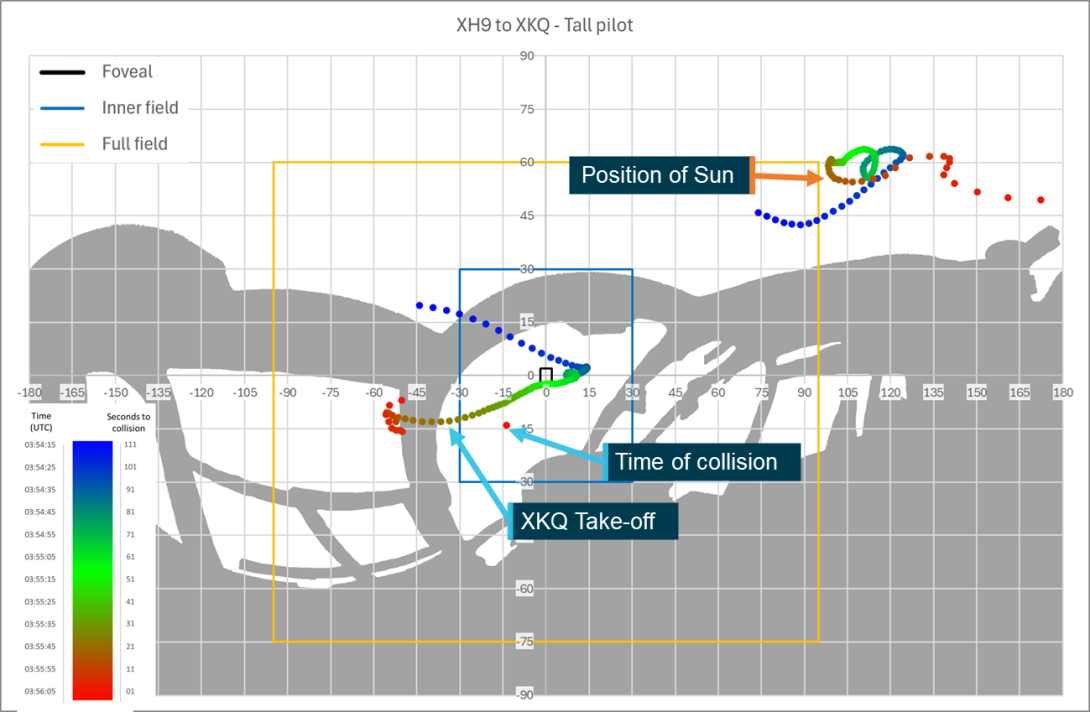
Source: ATSB
Figure 68: Sensitivity analysis tall head position shielding chart
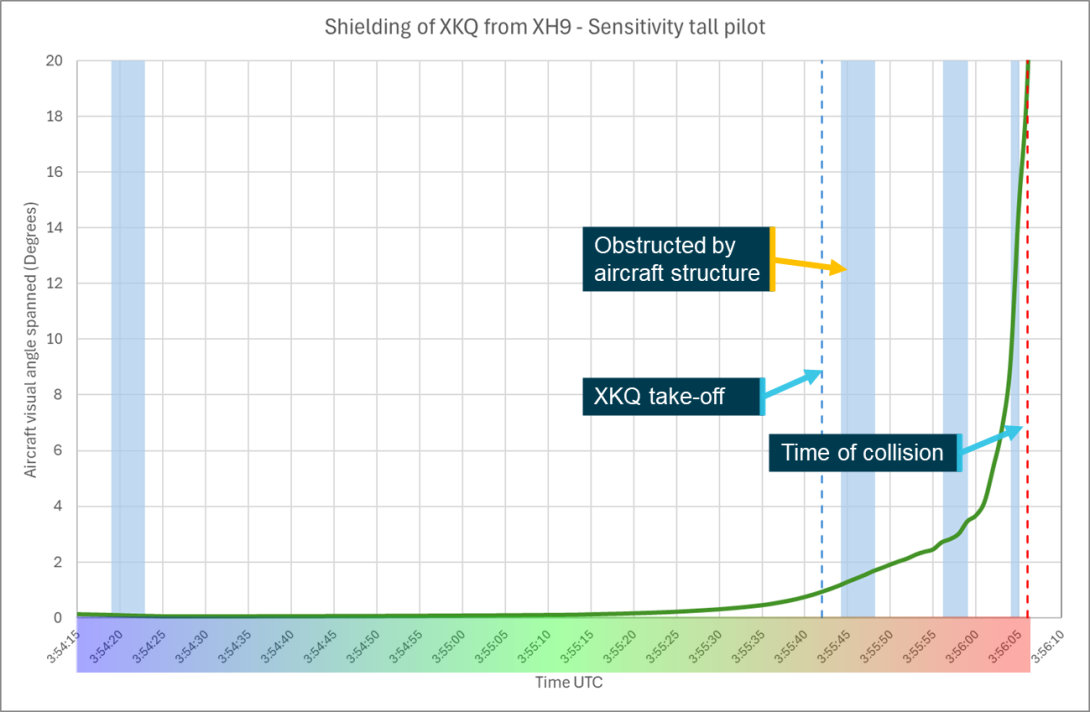
Source: ATSB
Figure 69: Sensitivity analysis short head position
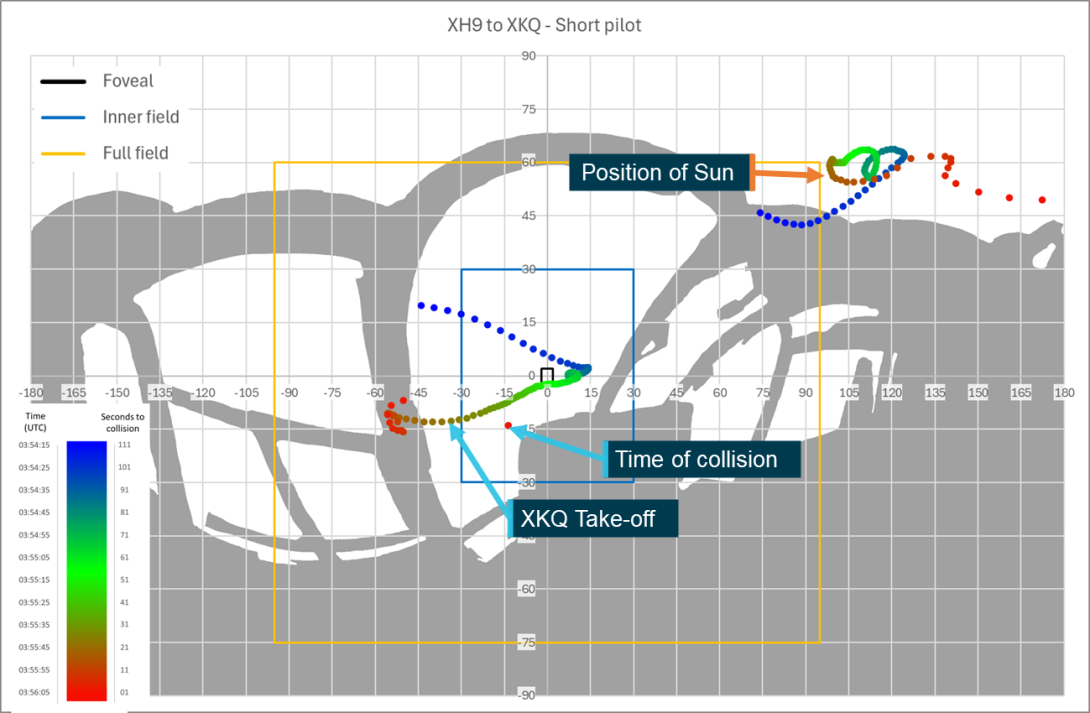
Source: ATSB
Figure 70: Sensitivity analysis short head position shielding chart
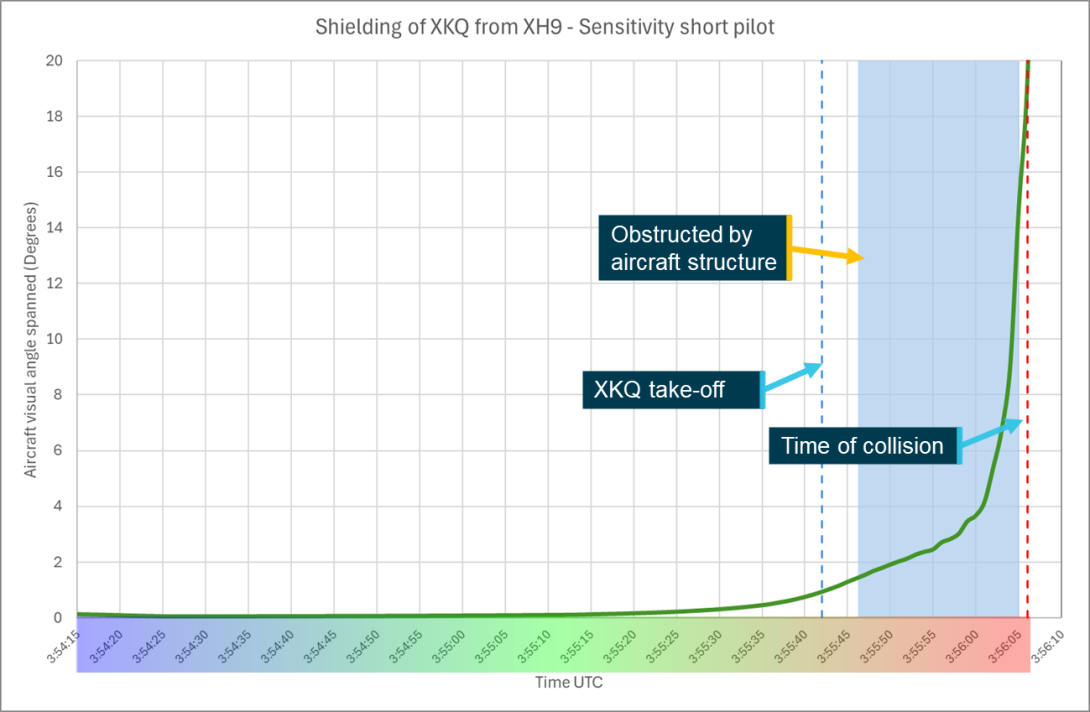
Source: ATSB
Figure 71: Sensitivity analysis head position 100 mm forward
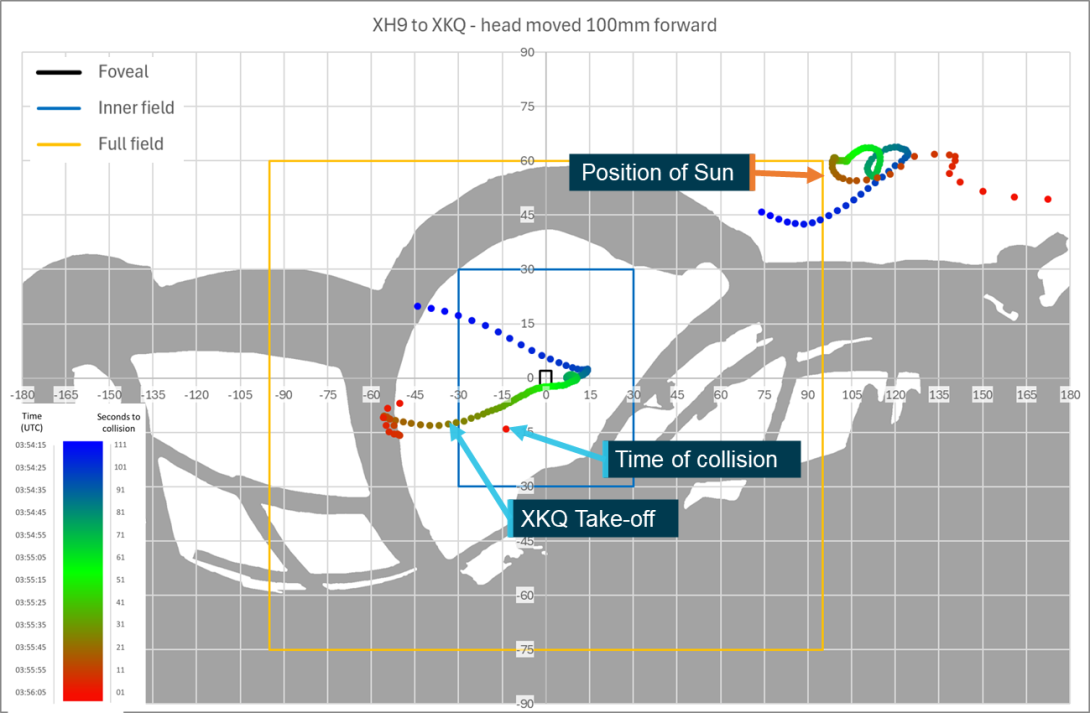
Source: ATSB
Figure 72: Sensitivity analysis head position 100 mm forward shielding chart
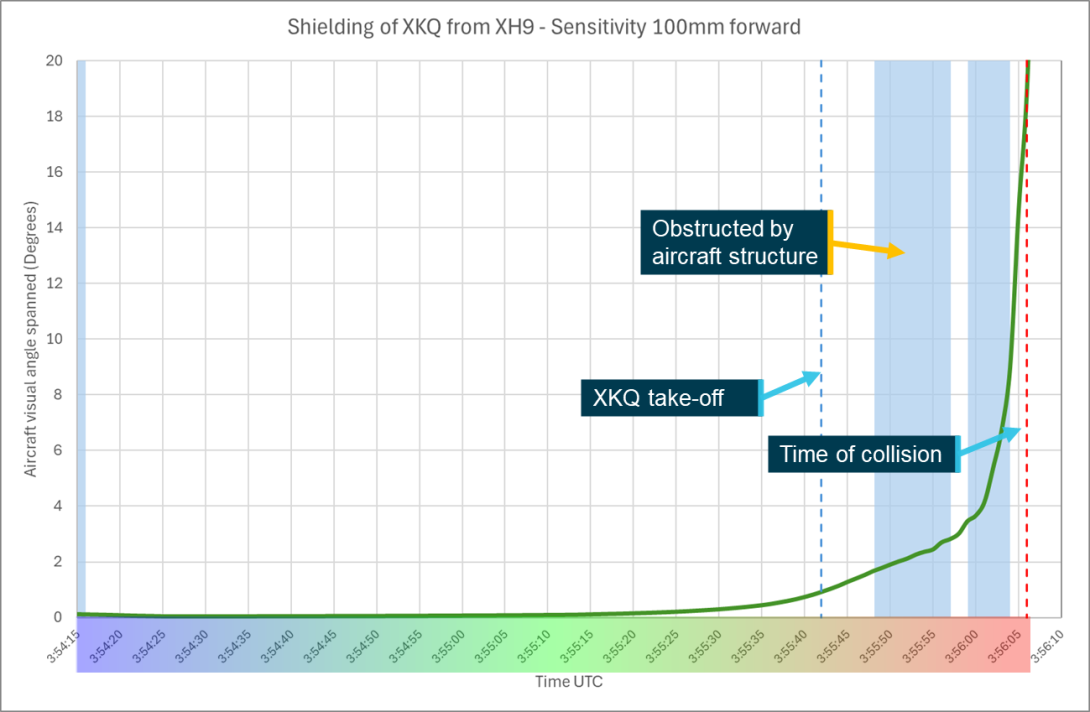
Source: ATSB
Figure 73: Sensitivity analysis head position 200 mm forward
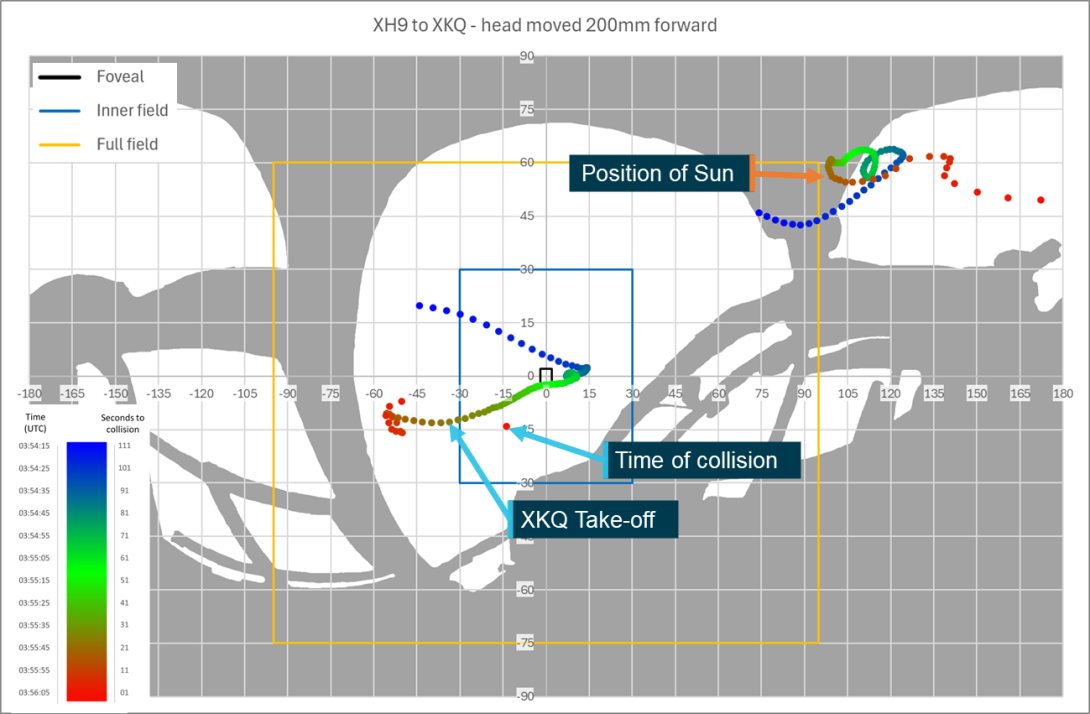
Source: ATSB
Figure 74: Sensitivity analysis head position forward 200 mm shielding chart
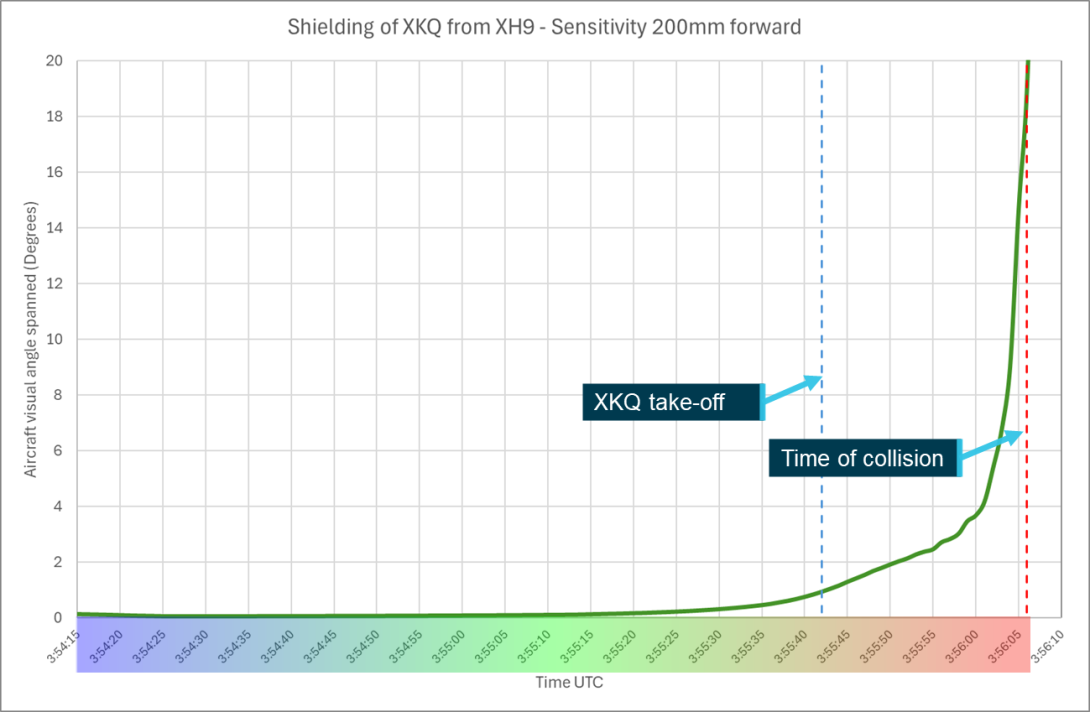
Source: ATSB
XKQ
The positional sensitivity analysis for XKQ is presented in the same 4 sections as that for XH9. The first looking at movements of the head 30 and 50 mm to the left of the DEP, the second 30 and 50 mm to the right of the DEP, the third section will consider the taller and shorter pilot views, and the final section will present the views moving the pilot’s head forward in 100mm increments. These 4 sections will consider the impact of shielding of the structure alone and not the pilot’s cap. An additional section will assess the impact of movements in the pilot’s cap. Figures showing the pilot’s view points and the shielding from each point are shown following the analysis. A summary of the figures can be found in Table 4.
For XKQ the target aircraft is initially unshielded appearing through the back left window almost directly behind the pilot. During this period the target aircraft will be unobstructed, however it would be of a size that would be unlikely to be detectable and the pilot would need to rotate their head position through the seat to be able to detect the target aircraft. The following analysis will only consider the shielding from 03:55:35, 7 seconds before XKQ departs the park pad.
Movement left
Moving the pilot’s eye position 30 mm to the left, as shown in Figure 77 and Figure 78 will have no impact on the shielding of the target aircraft with it remaining shielded by the centre cockpit pillar until the collision. Movement 50 mm to the left, as shown in Figure 75 and Figure 76 will present an opportunity where the aircraft is unshielded for 2 seconds at 03:55:59 and 03:56:00 and again at 03:56:03 at the top right edge of the pilot’s windscreen. Placing the estimated outline of the pilot’s cap over the pilot’s view, the end of the cap peak would shield the target aircraft from the view of the pilot of XKQ at this time.
Movement right
The movement of the pilot’s eye position to the right 50 or 30 mm as shown in Figure 79, Figure 80, Figure 81, and Figure 82 takes the relative position of the target aircraft back along the roof panel of the aircraft. For the final 32 seconds leading up to the collision the target aircraft remains shielded by the roof structure.
Pilot height
Vertical displacement of the eye position has a significant impact on the shielding of the target aircraft. Lifting the eye position, as shown in Figure 83 and Figure 84, moves the position of the roof structure down relative to the target aircraft. Subsequently, there is no change in shielding, with the target aircraft shielded by the roof and left centre cockpit pillar throughout the final 32 seconds of the approach.
Lowering the eye position provides the least shielded time, with the relative position of the viewer aircraft structure moved up. The target aircraft, as shown in Figure 85 and Figure 86, now passes through the right aircraft skylight, at 03:55:50 (16 seconds before the collision) and will then be unshielded in the aircraft’s central windscreen from 03:55:54 (12 seconds before the collision). This location, while unshielded, is in the outer field of view and on the opposite side of the centre left cockpit pillar, both of which will reduce the likelihood of detection. Positioning the estimated outline of the peak of the pilot’s cap over the view indicates that the cap would shield the target aircraft from the view of the pilot in this position.
Movement forward
As with XH9 the analysis considered the movement required to bring the target aircraft into the aircraft windscreen to improve the pilot’s opportunity for detection. To do this, the pilot’s eye position is moved forward in 100 mm increments between 100 and 500 mm. Moving the pilot’s eye position forward will move the relative position of the cockpit structure backwards. As the relative location of the target aircraft is close to the front edge of the centre left pillar a relatively small movement will impact the shielding and subsequently detectability. Moving the eye position 100 mm forward, as shown in Figure 87 and Figure 88, will mean that the target aircraft is not shielded by cockpit structure for 6 of the last 10 seconds leading up to the collision. Moving 200 mm forward, as shown in Figure 89 and Figure 90 will increase this to 9 of the final 10 seconds which is continued through 300 to 500 mm forward as shown in Figure 91, Figure 92, Figure 93, Figure 94, Figure 95 and Figure 96. This movement will mean the aircraft is not shielded by cockpit structure and can be seen through the pilot’s windscreen. However, the target aircraft remains in the outer visual field where detection is less likely.
During the lateral and vertical head movements the relative location of the peak of the pilot’s cap will not change relative to the position of the eyes. Subsequently, where the eye position movements presented in the sections above reduce the structural shielding, they will not impact the shielding of the pilot’s cap peak, as shown overlain on each of the vision maps. In each case the target aircraft remains shielded by the peak of the pilot’s cap until the collision. The following section will present discussion of the impact of the movement of the pilot’s cap on shielding of the target aircraft.
Cap movement
The shielding provided by the pilot’s cap is dictated by the position of the peak of the cap. There are 2 ways that the location of the peak can be altered. The first is that the cap is moved or positioned higher on the pilot’s head, the second is that the pilot rotates their head upwards. In both cases the peak of the cap will move upwards which will reduce the shielding on the pilot’s FOV.
If the cap, and subsequently the peak, is moved upwards (if the pilot lifts the cap on their head) there will be no impact on the pilot’s FOV or the relative position of the cockpit structure. Subsequently the pilot’s view remains the same, but less is shielded by the cap brim.
Accounting for a vertical rotation of the head is more complex. As the head rotates the brim of the cap and the eyes will rotate with it. This raises the peak of the brim up and the eyes will subsequently move upwards and rearwards from their original position. This moves the relative position of the cockpit structure. As the impact of movement of the eye position has been demonstrated previously, this scenario will assume that the movement in the position of the eyes is accounted for by movement of the torso so the relative position of the cockpit remains constant. The movement of the cap directly corresponds to the rotation of the head, if the head is rotated 10° upwards the elevational location of the cap’s peak will move the equivalent amount.
Figure 97 shows a 10° elevational rotation of the cap over the view from the 50 mm left eye position. The peak of the cap now appears above the relative location of the target aircraft meaning that it will not impact the pilot’s opportunity to visually acquire the target aircraft.
Figure 98 presents an alternate scenario where the head remains in the same relative position (using the 50 mm left eye position) but rotate with the head altering the pilot’s FOV upwards and bringing the position of the target aircraft closer to the pilot’s inner FOV.
In both cases, the movement of the cap means that for the 3 of the final 15 seconds where the aircraft is not shielded by the cockpit structure, it is unobstructed providing an opportunity for detection.
Table 4: XKQ sensitivity analysis figures
| Figure Number | Movement | Magnitude (mm) | Chart type |
| Figure 75 | Left | 50 | Vision map (with cap overlay) |
| Figure 76 | Left | 50 | Shielding chart |
| Figure 77 | Left | 30 | Vision map |
| Figure 78 | Left | 30 | Shielding chart |
| Figure 79 | Right | 50 | Vision map |
| Figure 80 | Right | 50 | Shielding chart |
| Figure 81 | Right | 30 | Vision map |
| Figure 82 | Right | 30 | Shielding chart |
| Figure 83 | Tall | Vision map | |
| Figure 84 | Tall | Shielding chart | |
| Figure 85 | Short | Vision map | |
| Figure 86 | Short | Shielding chart | |
| Figure 87 | Forward | 100 | Vision map (with cap overlay) |
| Figure 88 | Forward | 100 | Shielding chart |
| Figure 89 | Forward | 200 | Vision map (with cap overlay) |
| Figure 90 | Forward | 200 | Shielding chart |
| Figure 91 | Forward | 300 | Vision map (with cap overlay) |
| Figure 92 | Forward | 300 | Shielding chart |
| Figure 93 | Forward | 400 | Vision map (with cap overlay) |
| Figure 94 | Forward | 400 | Shielding chart |
| Figure 95 | Forward | 500 | Vision map (with cap overlay) |
| Figure 96 | Forward | 500 | Shielding chart |
| Figure 97 | Cap | Vertical | Vision map (with cap overlay) |
| Figure 98 | Cap | Head Rotation | Vision map (with cap overlay) |
Figure 75: Sensitivity analysis head position 50 mm left
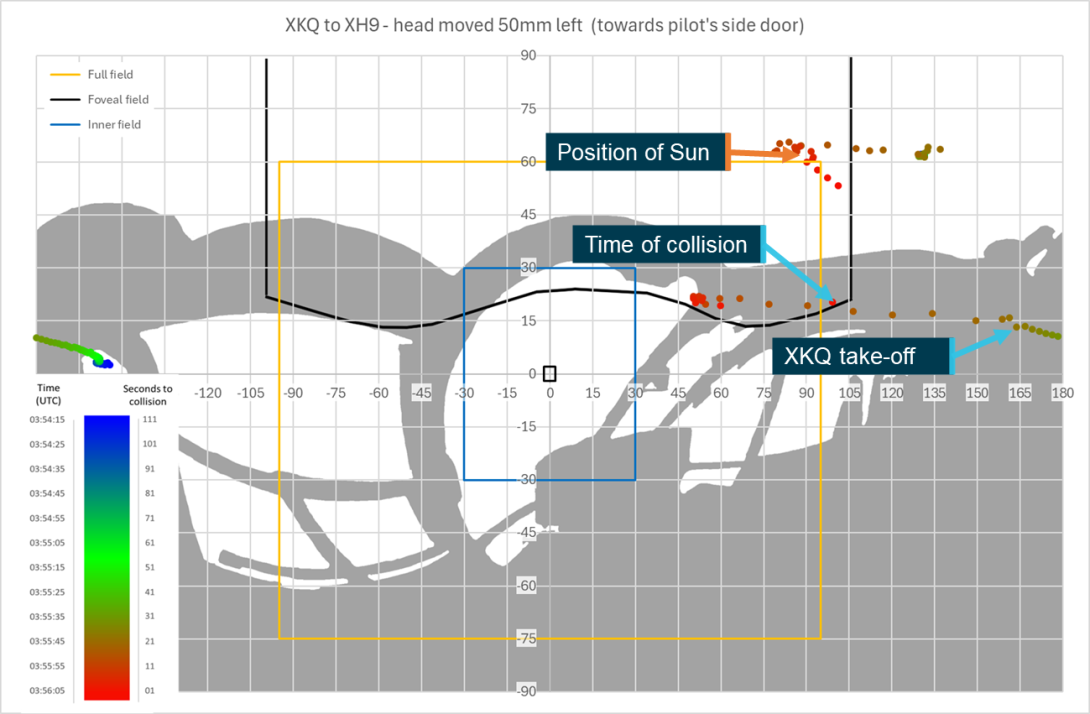
Source: ATSB
Figure 76: Sensitivity analysis head position 50 mm left shielding chart
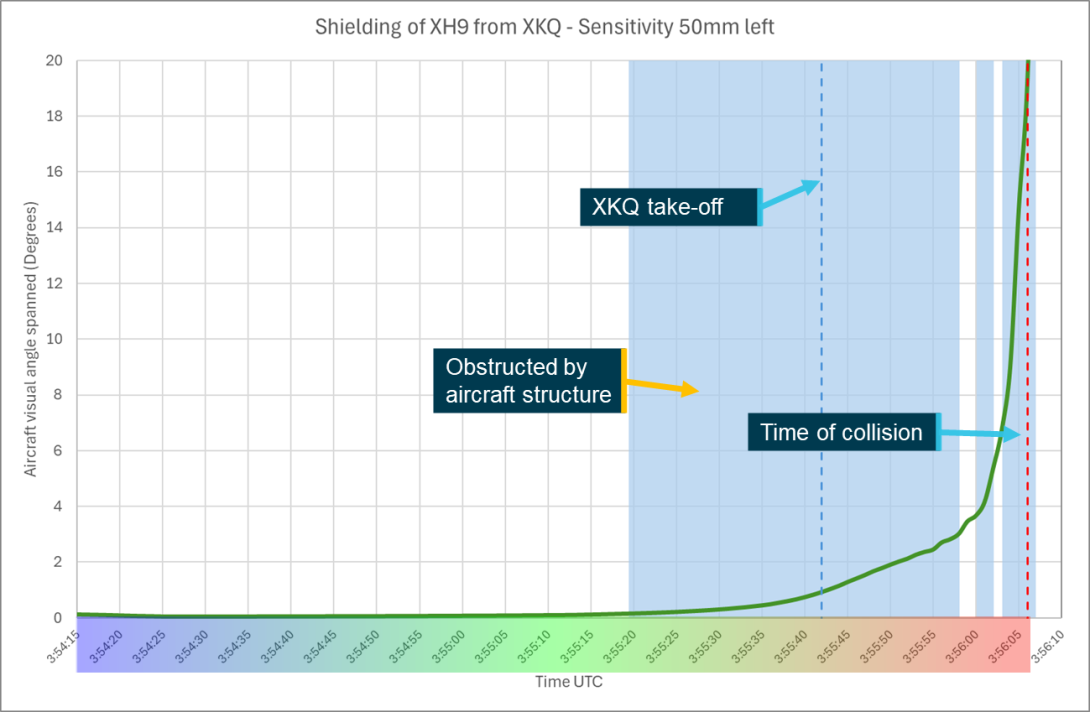
Source: ATSB
Figure 77: Sensitivity analysis head position 30 mm left
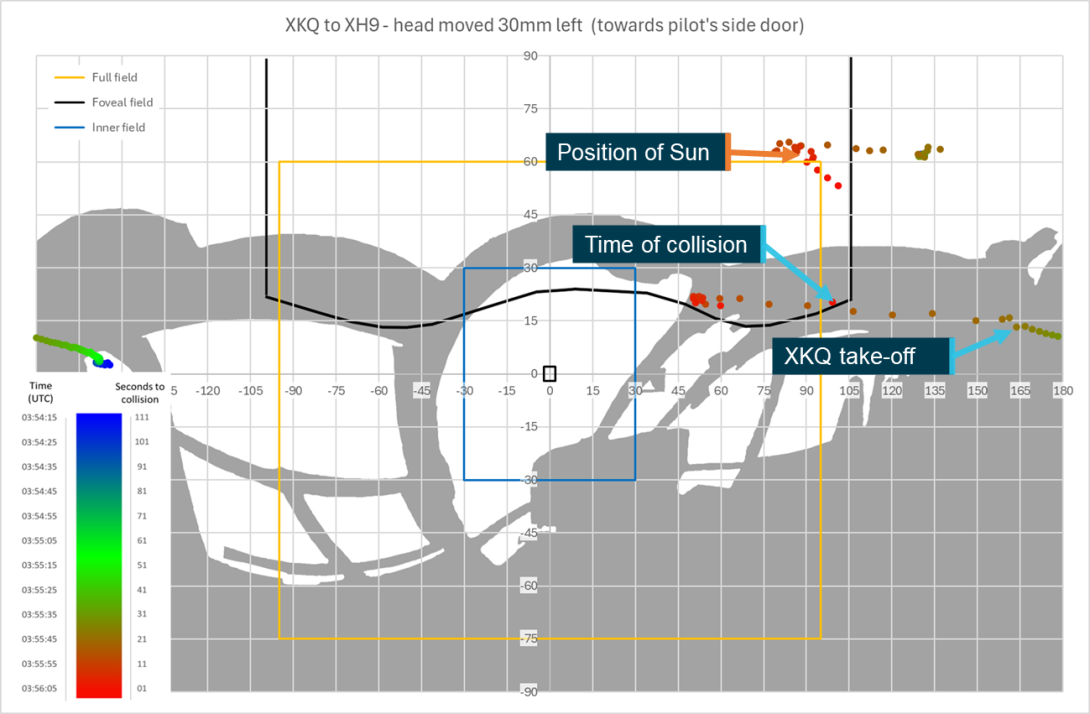
Source: ATSB
Figure 78: Sensitivity analysis head position 30 mm left shielding chart
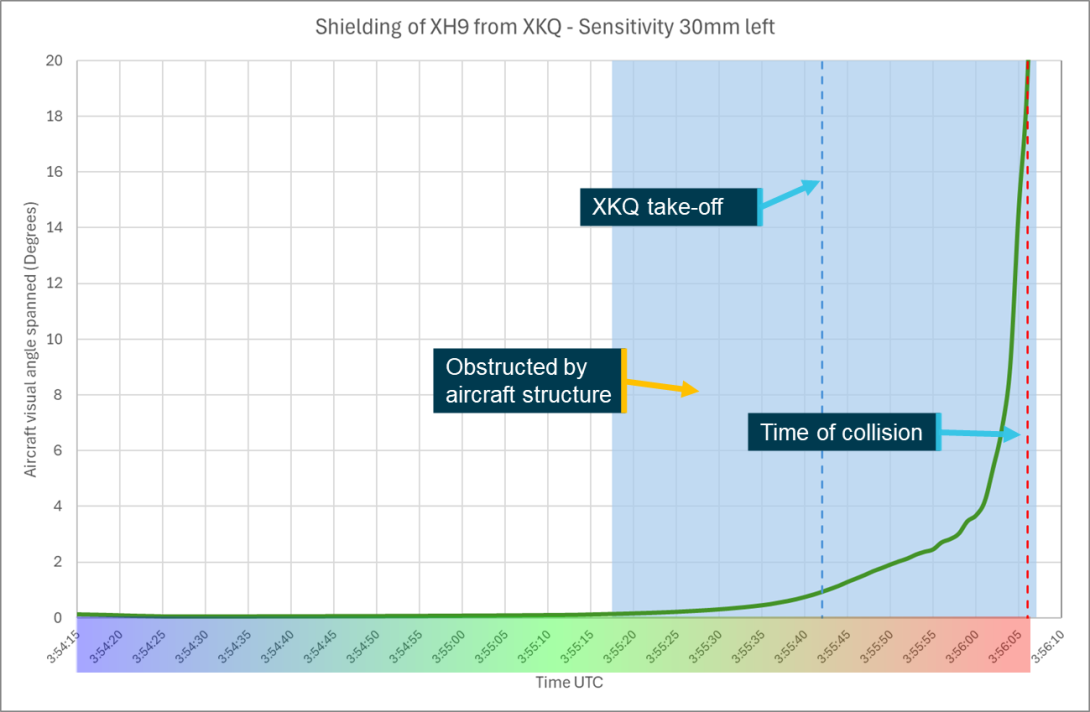
Source: ATSB
Figure 79: Sensitivity analysis head position 50 mm right

Source: ATSB
Figure 80: Sensitivity analysis head position 50 mm right shielding chart
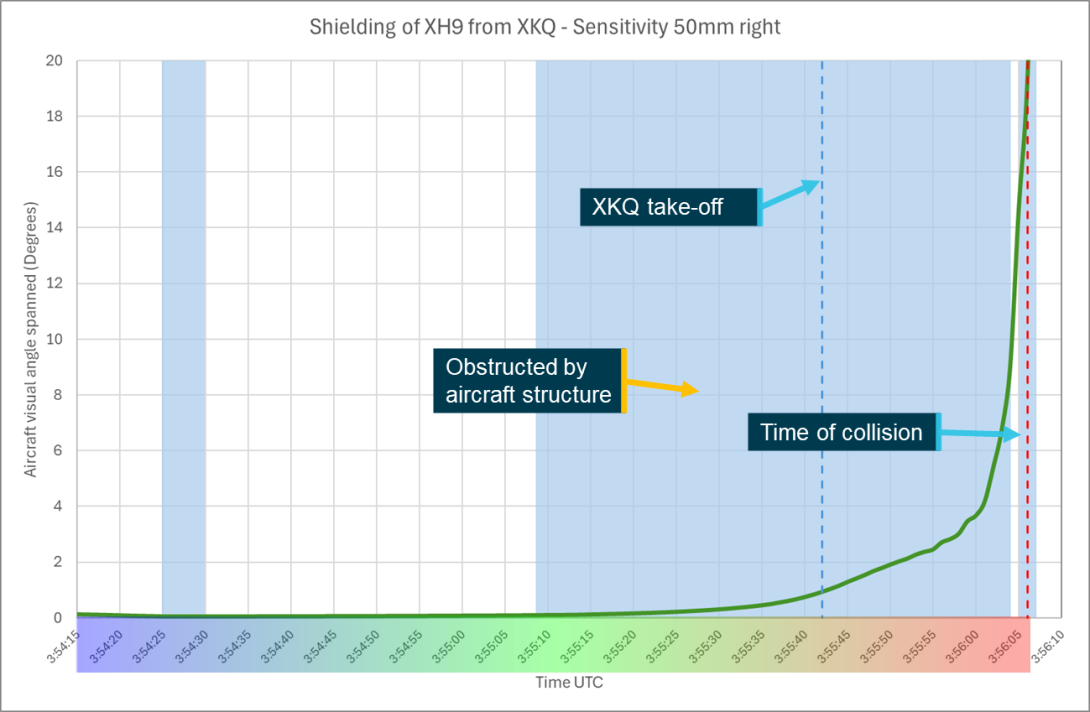
Source: ATSB
Figure 81: Sensitivity analysis head position 30 mm right
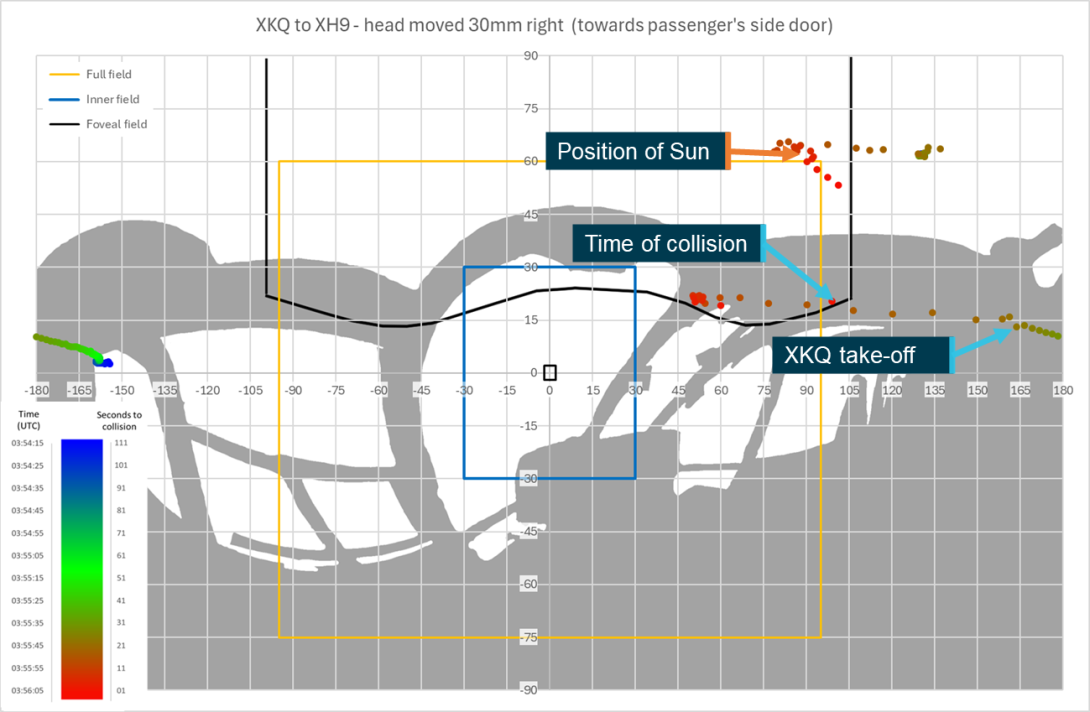
Source: ATSB
Figure 82: Sensitivity analysis head position 30 mm right shielding chart
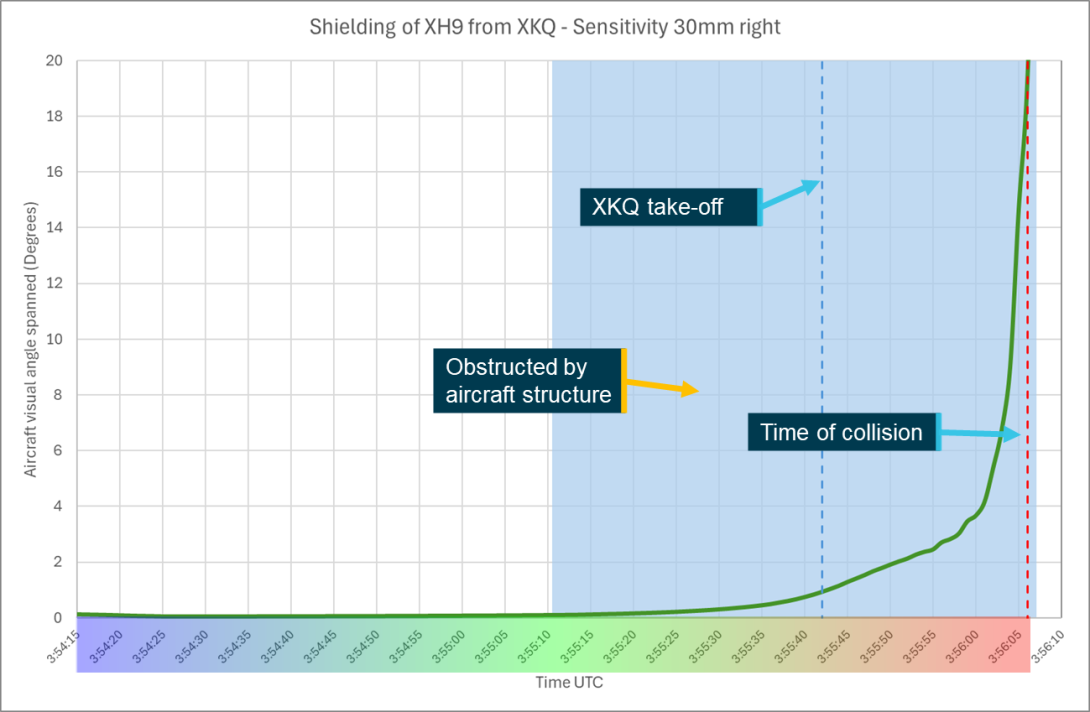
Source: ATSB
Figure 83: Sensitivity analysis tall head position
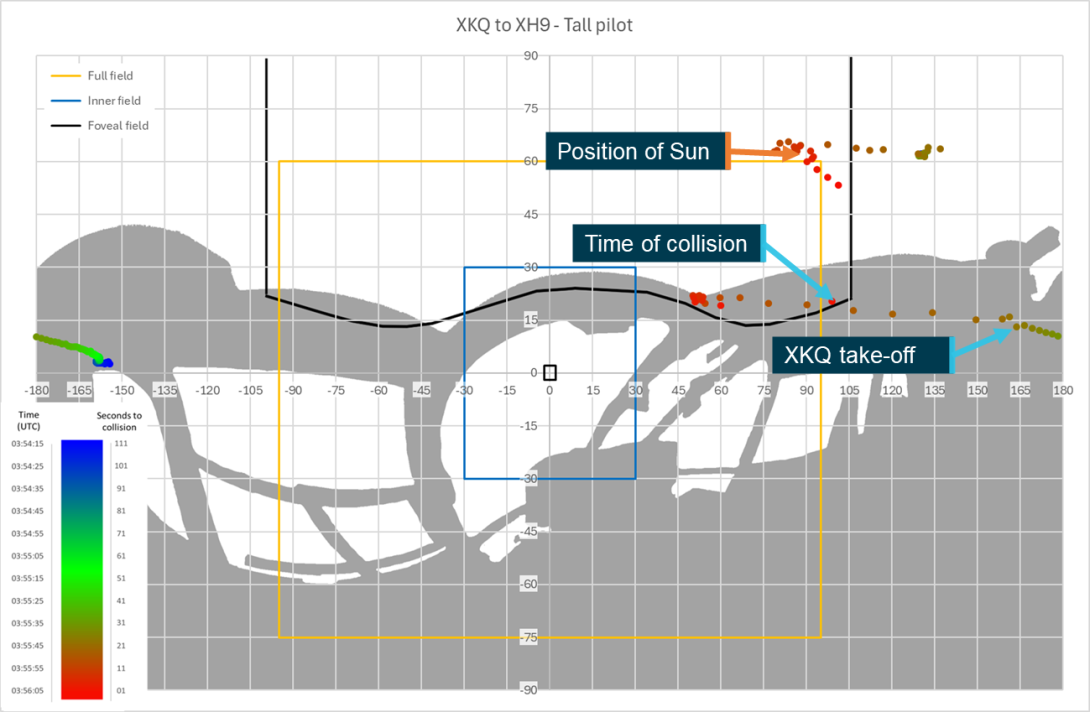
Source: ATSB
Figure 84: Sensitivity analysis tall head position shielding chart
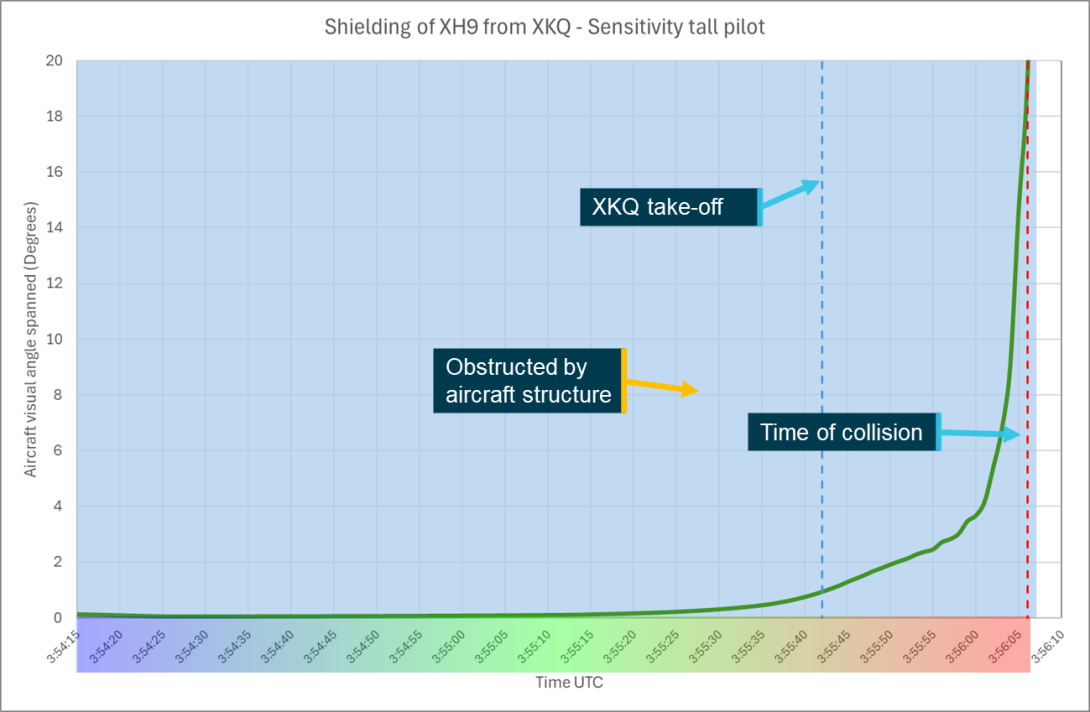
Source: ATSB
Figure 85: Sensitivity analysis short head position
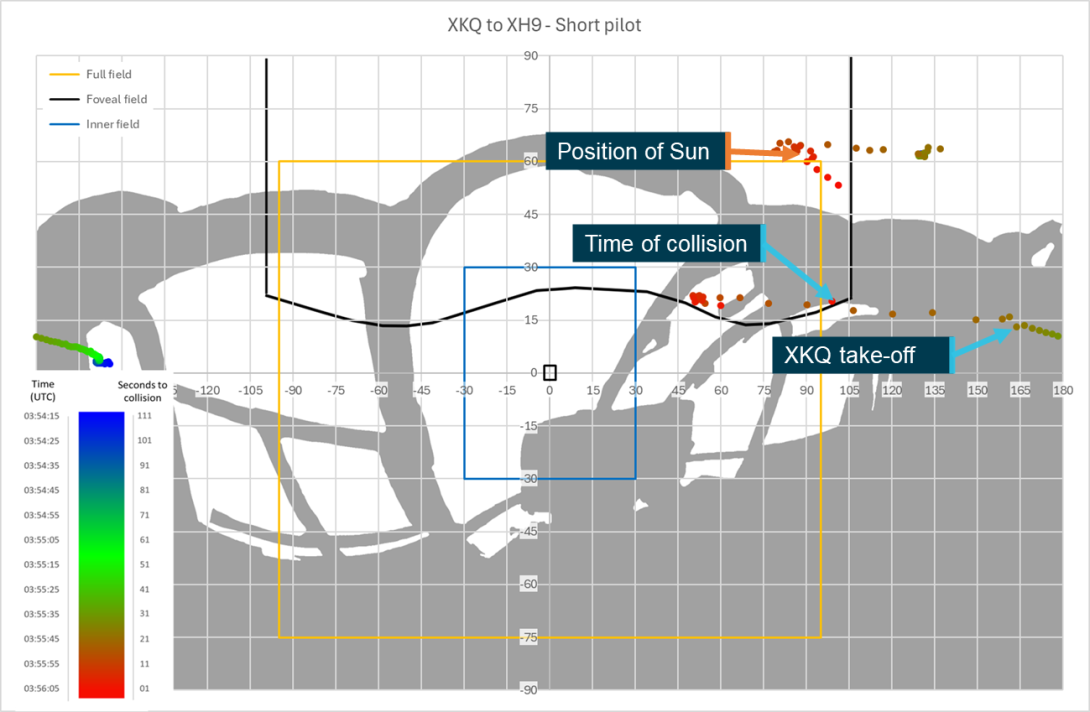
Source: ATSB
Figure 86: Sensitivity analysis short head position shielding chart
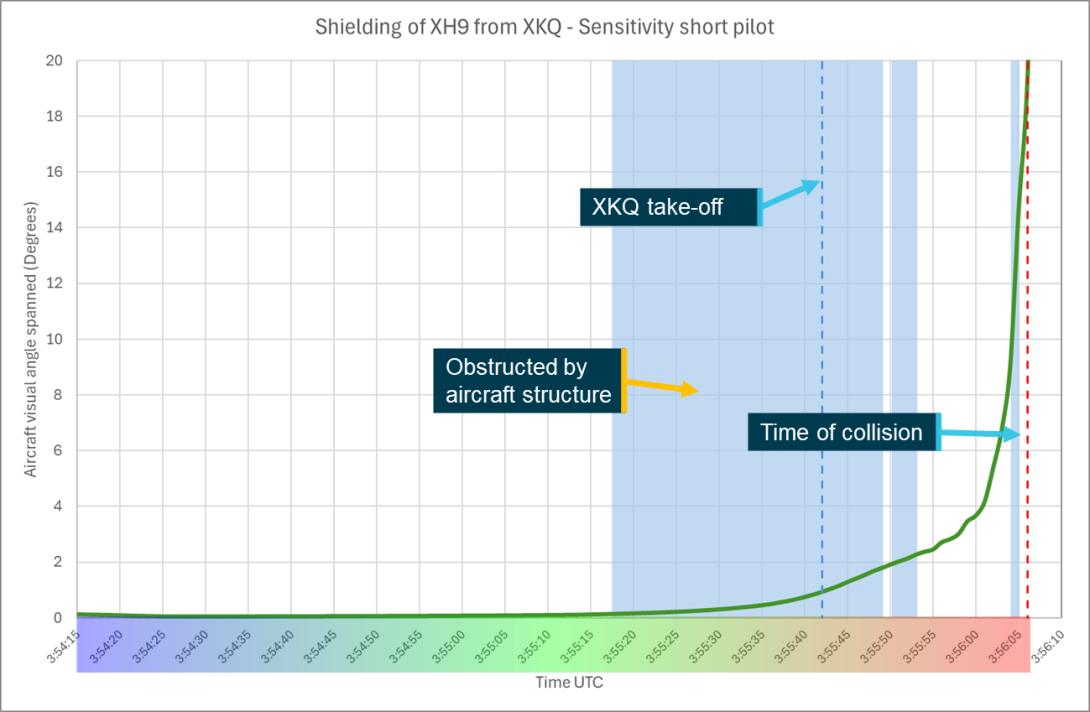
Source: ATSB
Figure 87: Sensitivity analysis head position 100 mm forward
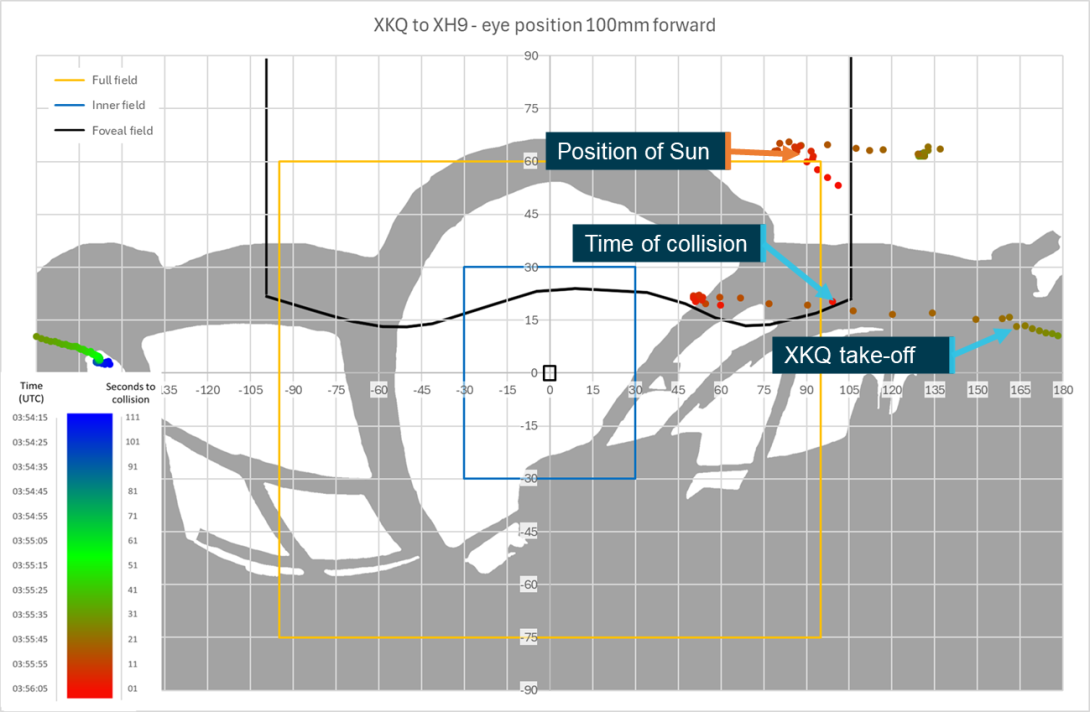
Source: ATSB
Figure 88: Sensitivity analysis head position 100 mm forward shielding chart

Source: ATSB
Figure 89: Sensitivity analysis head position 200 mm forward
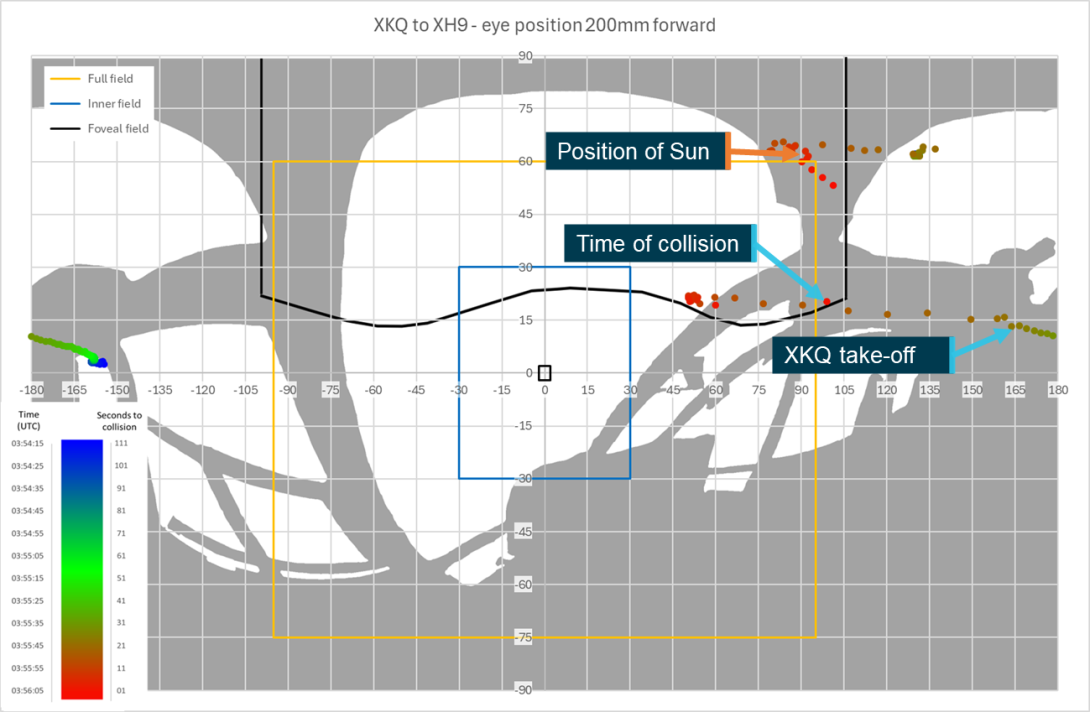
Source: ATSB
Figure 90: Sensitivity analysis head position forward 200 mm shielding chart
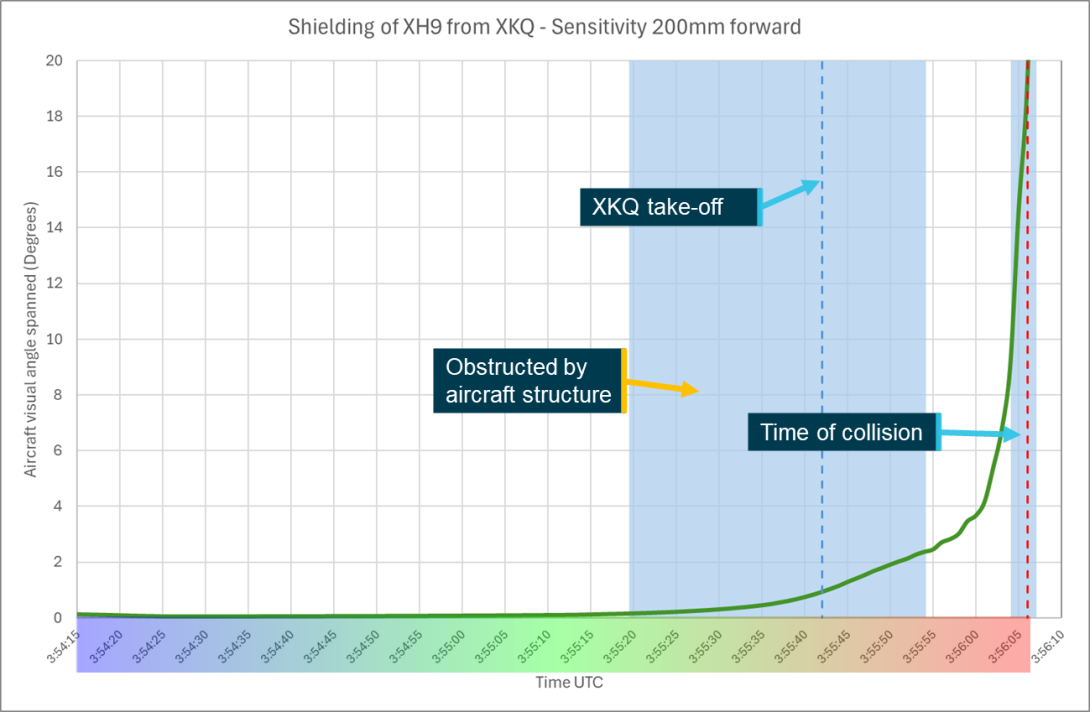
Source: ATSB
Figure 91: Sensitivity analysis head position 300 mm forward
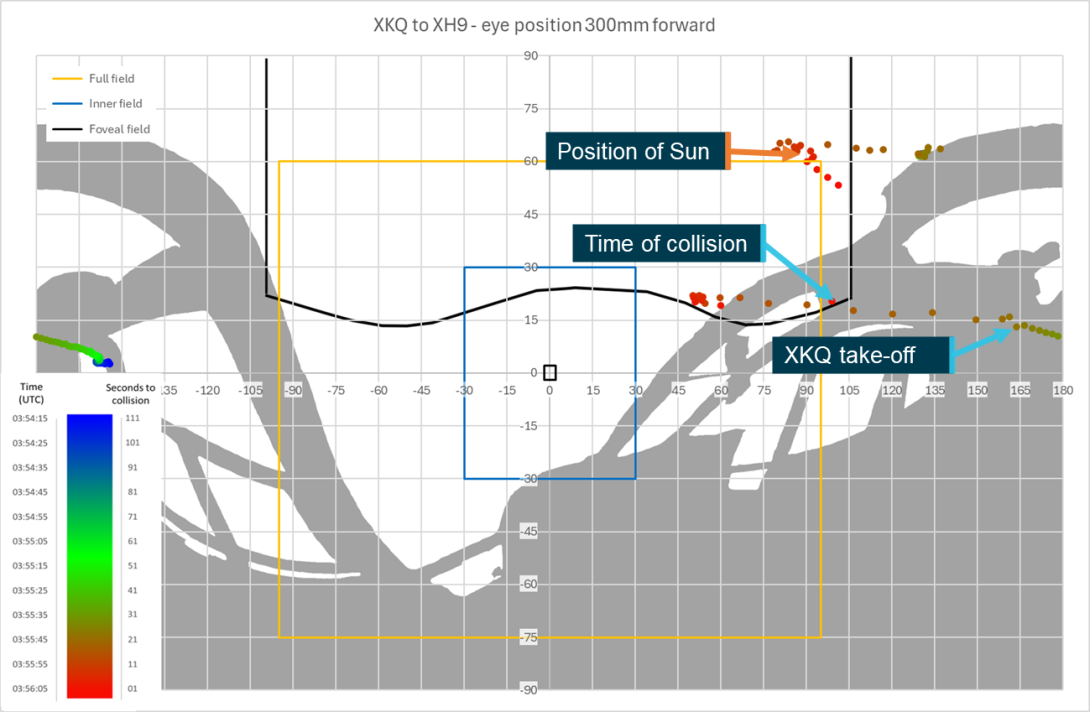
Source: ATSB
Figure 92: Sensitivity analysis head position forward 300 mm shielding chart
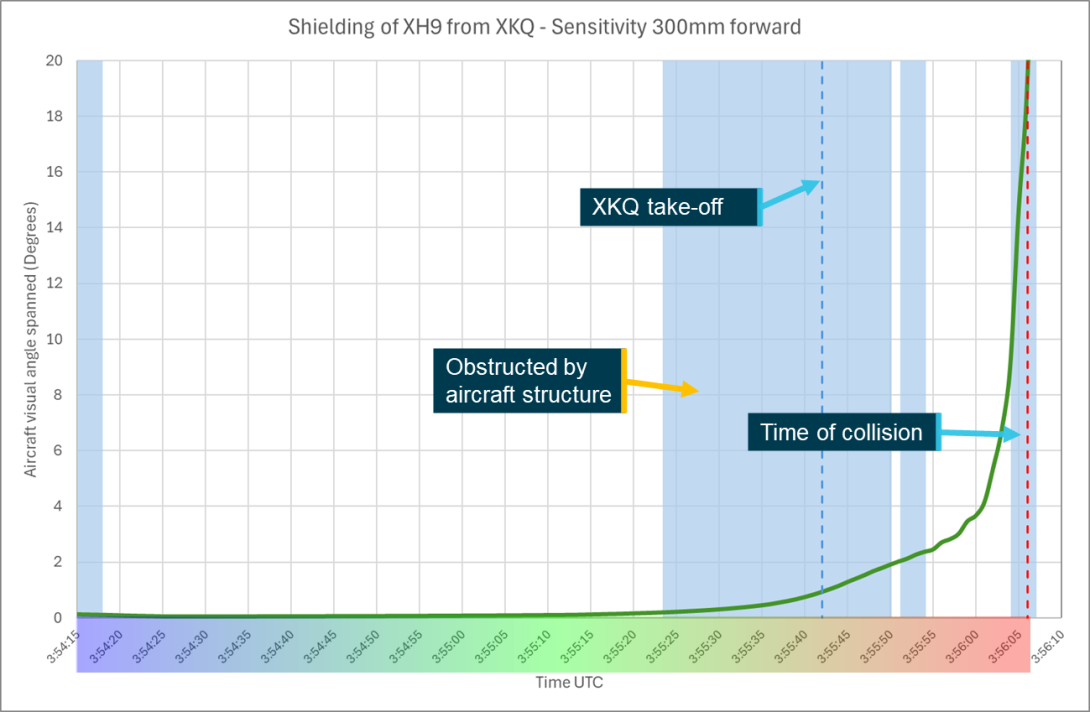
Source: ATSB
Figure 93: Sensitivity analysis head position 400 mm forward
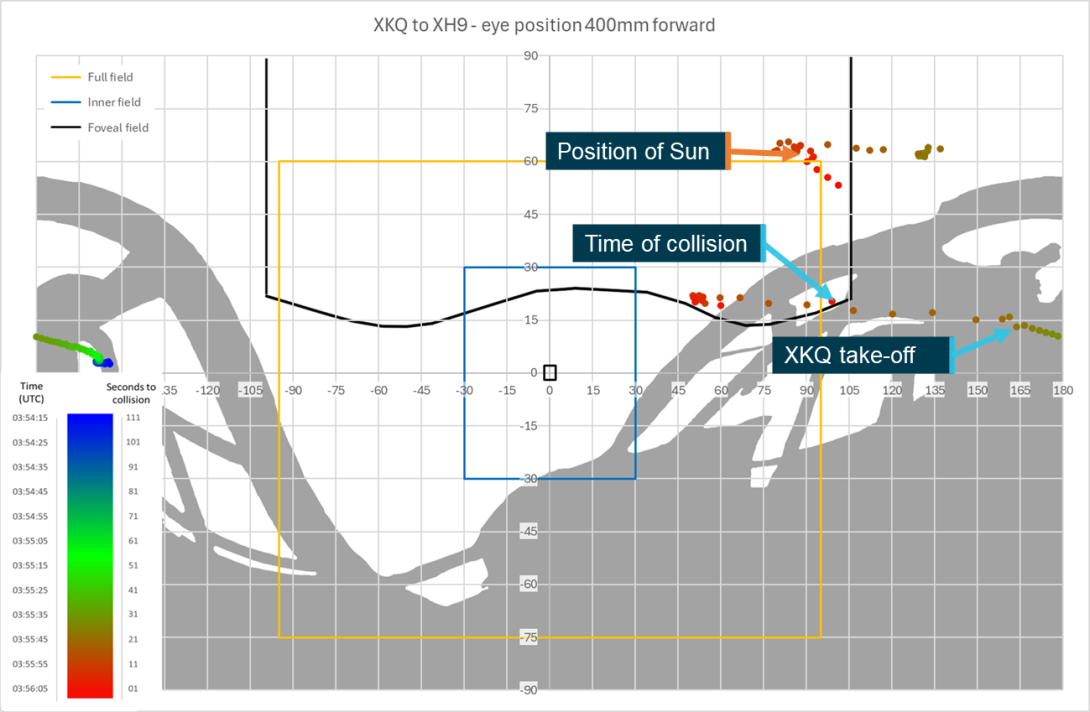
Source: ATSB
Figure 94: Sensitivity analysis head position forward 400 mm shielding chart
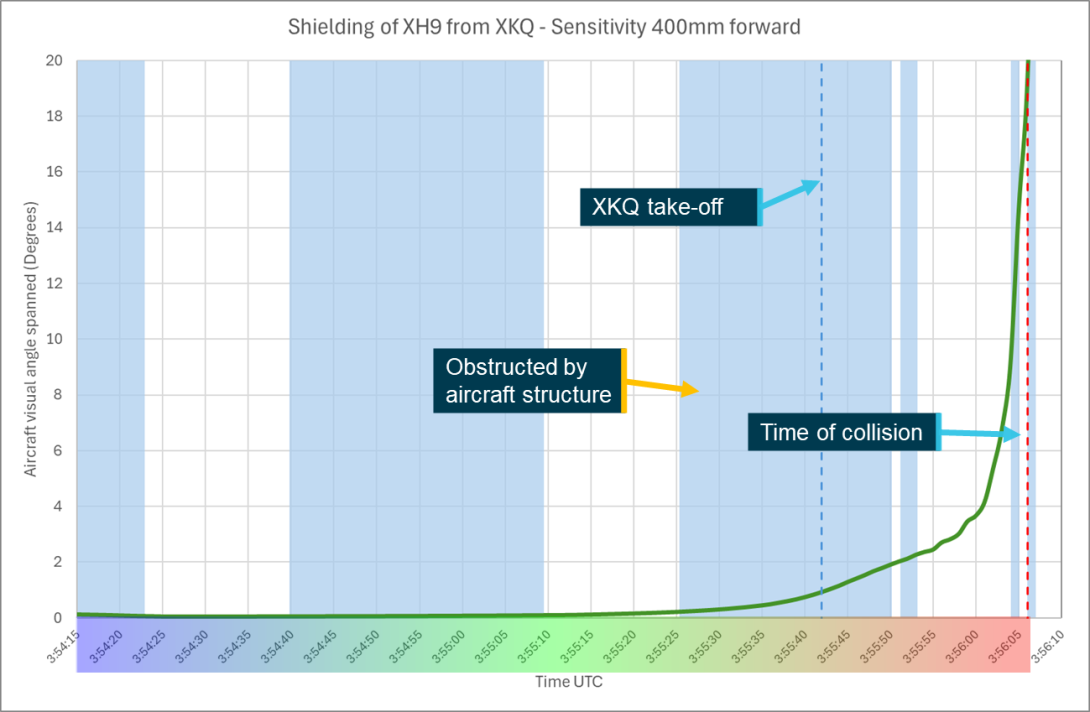
Source: ATSB
Figure 95: Sensitivity analysis head position 500 mm forward
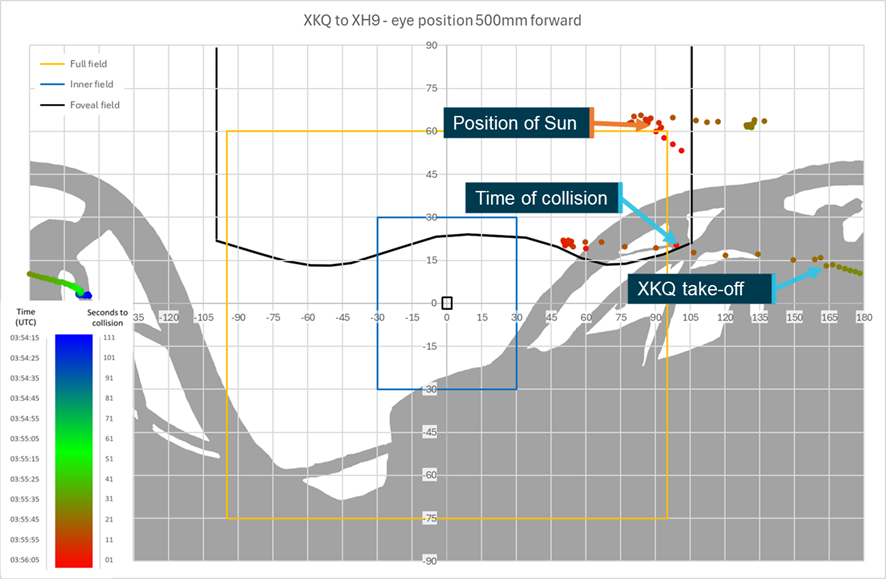
Source: ATSB
Figure 96: Sensitivity analysis head position forward 500 mm shielding chart
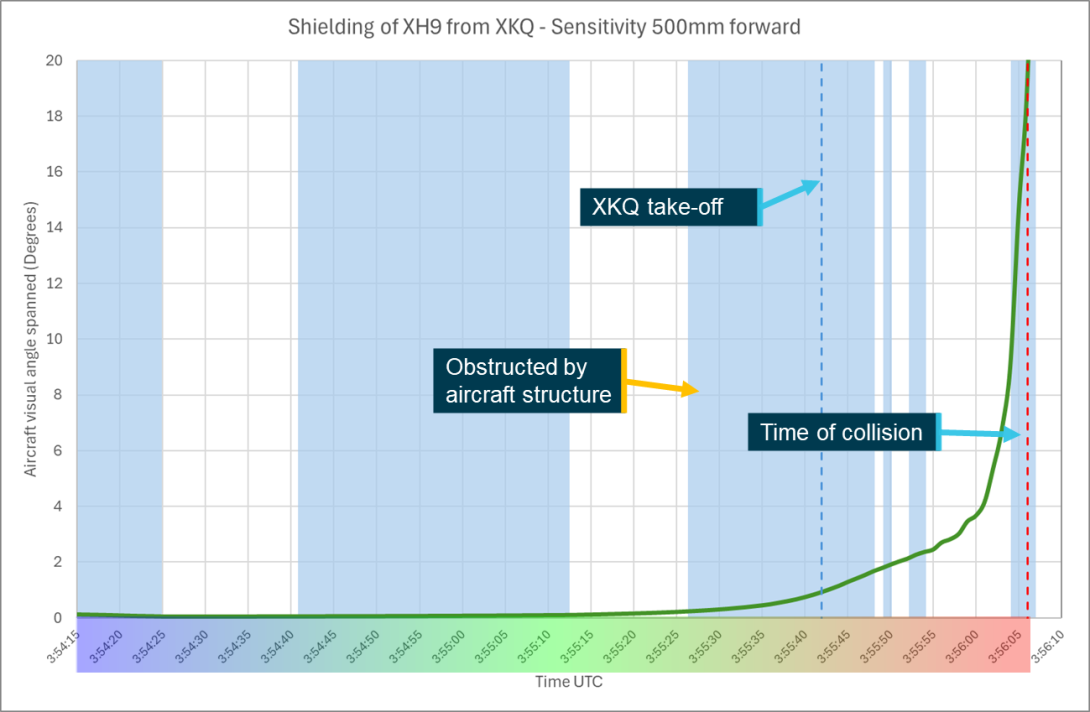
Source: ATSB
Figure 97: Sensitivity analysis cap moved vertically
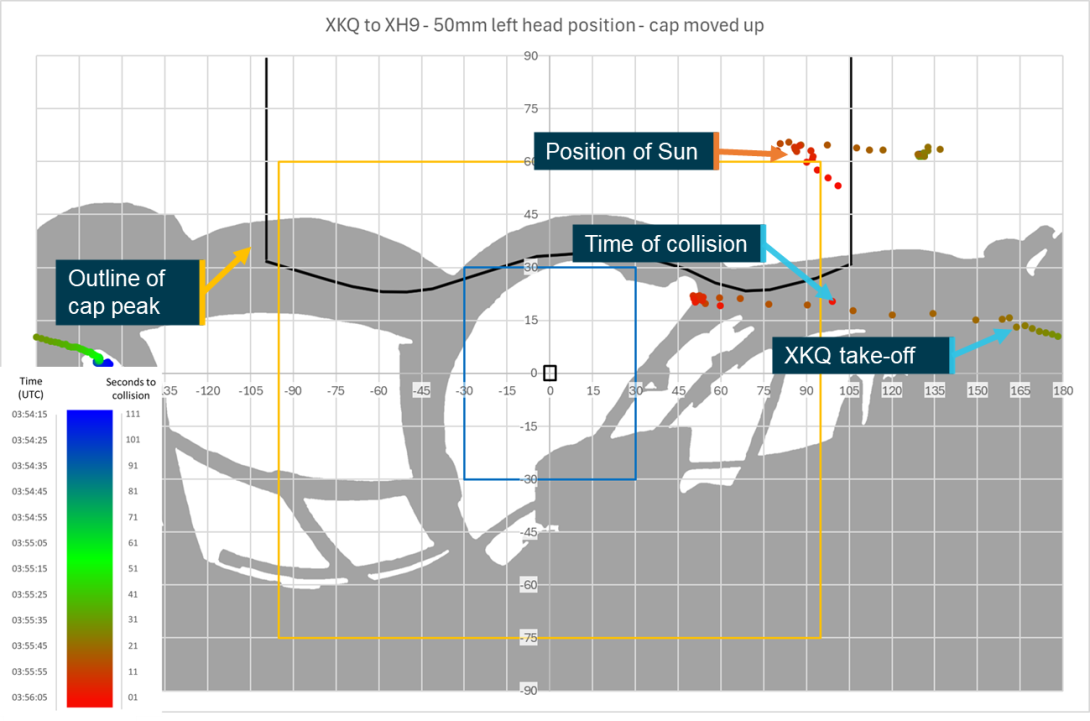
Source: ATSB
Figure 98: Sensitivity analysis head rotated vertically
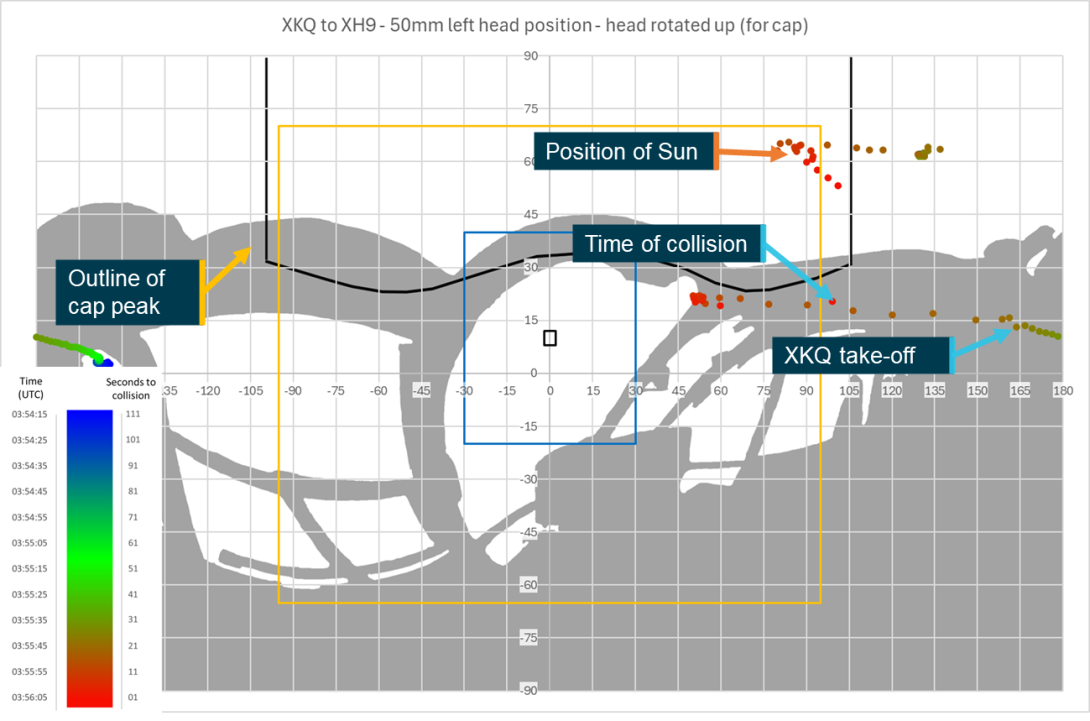
Source: ATSB
Sensitivity analysis – eye rotation
Based on the video footage it is not possible to determine what the pilots were looking at during the lead‑up to the collision as all the onboard footage was taken from behind or beside the pilots and they were wearing sunglasses. The sensitivity analysis will consider positive and negative azimuthal and elevation rotations of 9° to demonstrate the effect of eye rotation on the detectability of the target aircraft. It will additionally consider the impact of rotation for a scenario of each aircraft that is assessed to be substantially similar to the accident scenario. These rotations will all be applied to the baseline pilot’s eye position (see Figure 44 and Figure 52 for comparison) that has been used through the earlier sections of the report.
XH9
For the pilot of XH9 4 figures were developed presenting 9° rotations of the FOV which would be experienced by rotating the eyes. The charts maintain one centred parameter while changing the other, for example in Figure 99, the chart shows a positive 9° azimuthal rotation (right) with the elevation remaining centred.
In the final stages leading up to the collision the aircraft tracks right to left and down through the pilot’s FOV. Positive azimuthal or elevational rotations, rotating the eyes up or right, take the pilot’s view away from location of the target aircraft as the aircraft approach one another. Figure 99 shows a 9° positive azimuthal rotation (right) to the pilot’s eyes. This brings the target aircraft (XKQ) into the foveal region between 03:54:42 and 03:55:05, however during this time aircraft visual angle spanned between 0.08° and 0.13° which is below the threshold of likely detection and while XKQ is still located on the pad. At the time the target aircraft (XKQ) is departing the park pad, a critical time for the pilot to detect a change in threat status, it appears almost 10° further outside of the inner field than it was with the azimuth value centred, decreasing the likelihood of detection at this point. Additionally, this positive rotation makes the sun more visible in the upper right corner of the pilot’s FOV which could promote glare and reduce the pilot’s likelihood of detection of the target aircraft. Figure 100 shows a positive 9° elevational rotation (up), the target aircraft does not enter the foveal region, passing just outside the corner of it at 03:54:25 when the aircraft spans 0.06° and is highly unlikely to be visually acquired. As the aircraft transits down and across the windscreen it passes further from the foveal region to the edge of the inner visual field, as XKQ departs the pad. The appearance lower in the visual field will make visual detection less likely than with the elevation value centred.
A negative azimuthal rotation (eyes left), as shown in Figure 101, improves the opportunity for detection of the target aircraft. While the target aircraft does not appear in the foveal region, passing below it, when it lifts off the pad it appears in the inner visual field and remains, for the first 3 seconds after lift-off, within but on the far left side of the inner visual where the likelihood of detection is higher than in the outer visual field, where it appears with the azimuth centred. This rotation of the eyes also moves the position of the sun further away from the pilot’s FOV decreasing the likelihood that glare would affect the pilot’s ability to detect the target aircraft. A 9° negative elevational rotation, as shown in Figure 102, has minimal impact on the visual detection opportunity compared to the centred view. The target aircraft will track slightly further from and now above the foveal region of the FOV, rather than below it when elevation is centred. There is no impact on the detection opportunity at the time that the target aircraft XKQ lifts off from the pad, meaning that it will still appear outside of the inner visual field, reducing the opportunity for detection by the pilot. While the sun will still be in the pilot’s FOV for the first 8 seconds of the study window the negative elevational rotation will take the sun out of and further away from the pilot’s FOV reducing the likelihood of glare impacting the pilot’s opportunity for detection of the target aircraft.
Figure 99: XH9 pilot’s view with +9 degree azimuth rotation
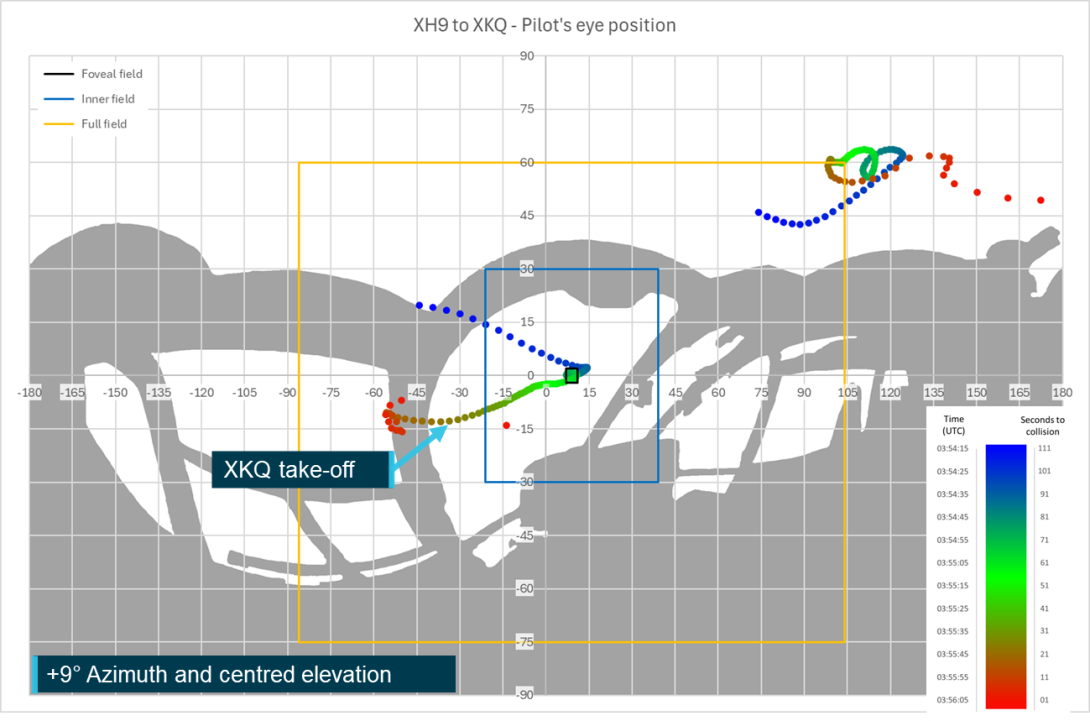
Source: ATSB
Figure 100: XH9 pilots view with +9 degree elevation rotation
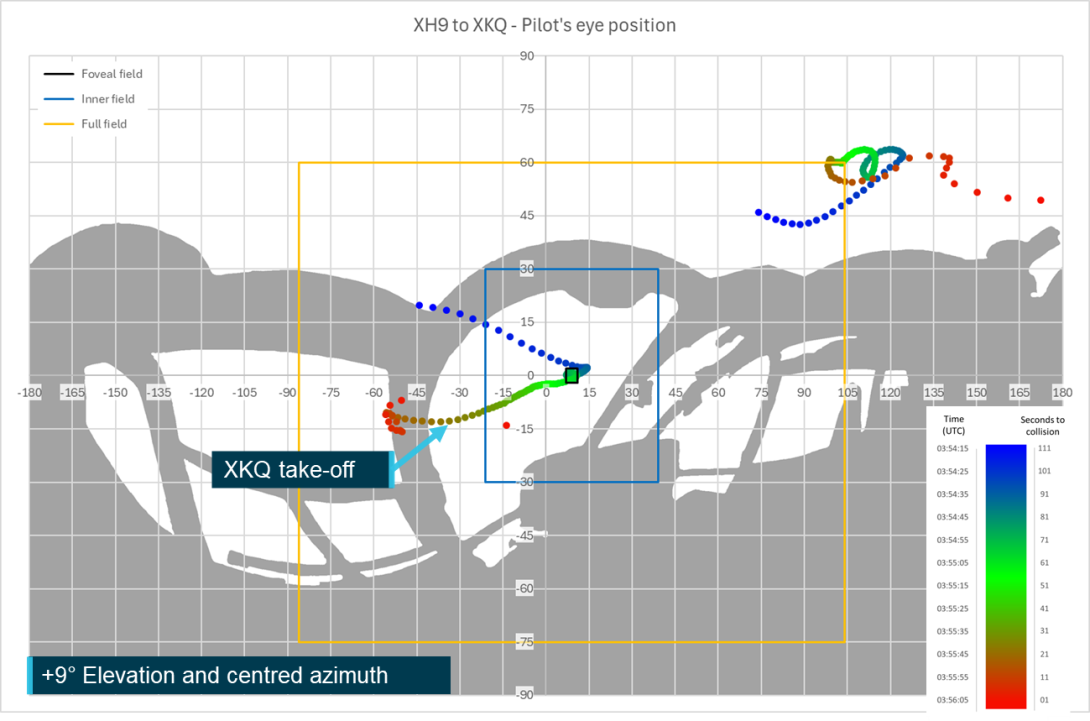
Source: ATSB
Figure 101: XH9 pilot's view with -9 degree azimuth rotation

Source: ATSB
Figure 102: XH9 pilot's view with -9 degree elevation rotation

Source: ATSB
In addition to the consideration of these rotations 2 additional scenarios were assessed based on evidence presented in the investigation report. The first was that the pilot of XH9 was focused on their approach to the helipad and a boat passing across their approach path. The ATSB sought to assess the impact on the detectability of the target aircraft if the pilot was looking at their aiming point, pad 3 of the operator’s heliport, at the time that XKQ lifted from the pad. The relative position of the pad from XH9 was calculated throughout the study window, the position at the time that XKQ lifted from the pad was plotted and the field of view was centred on this position. The time that XKQ lifted from the pad was chosen as this was a time that the aircraft was changing threat status, and the movement provided an increased opportunity for detection. Figure 103 shows the pilot’s FOV centred on the relative position of the helipad at the time the XKQ lifted from the park pad. At the time XKQ departed the pad XH9 was still north of the park pad meaning that both XKQ and pad 3 of the heliport were to the pilot’s left, pad 3 appears closer to the centre as it is further south than XKQ on the park pad. The rotation, −19° azimuth and −8° elevation, to centre the pad means that the target aircraft was within the inner field of the pilot’s FOV increasing the likelihood of detection. It is important to note that this analysis only considers the potential impact of the relative position of the target aircraft and not the impact of the environment around the target aircraft.
Figure 103: XH9 pilot's FOV centred on heliport pad 3 when XKQ takes off
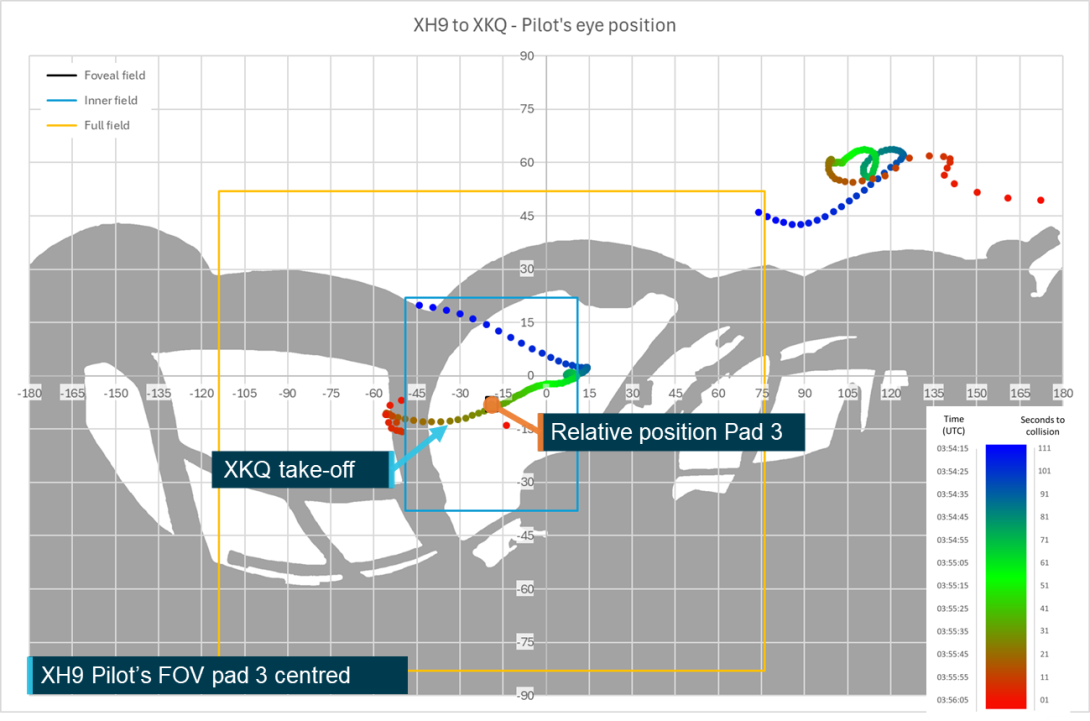
Note: As the foveal region has been centred on the relative position of pad 3 the marker indicating this position is larger than the depicted foveal region and appears behind the marker for the relative position of pad 3. Source: ATSB
The second scenario considered how far the pilot would need to rotate their eyes to look directly at the target aircraft as it departed the park pad. Figure 104 focuses the centre of the FOV at the position of the target aircraft at the time it lifted from the park pad. To centre the foveal region on the departing aircraft and gain the maximum detection opportunity for its change in status would have required rotations of −31° azimuth and −12° elevation. These are well within the 55° limit of human eye rotation. However, it has been identified that for movements greater than 20–30° of azimuth the head will rotate so the eyes do not need to go to the limits of their rotation (Franchak, McGee, & Blanch, 2021), subsequently this rotation may be better represented by rotations as presented in both the eye position and eye rotation sections of the Sensitivity analysis.
Figure 104: XH9 pilot's FOV centred on XKQ as it takes off
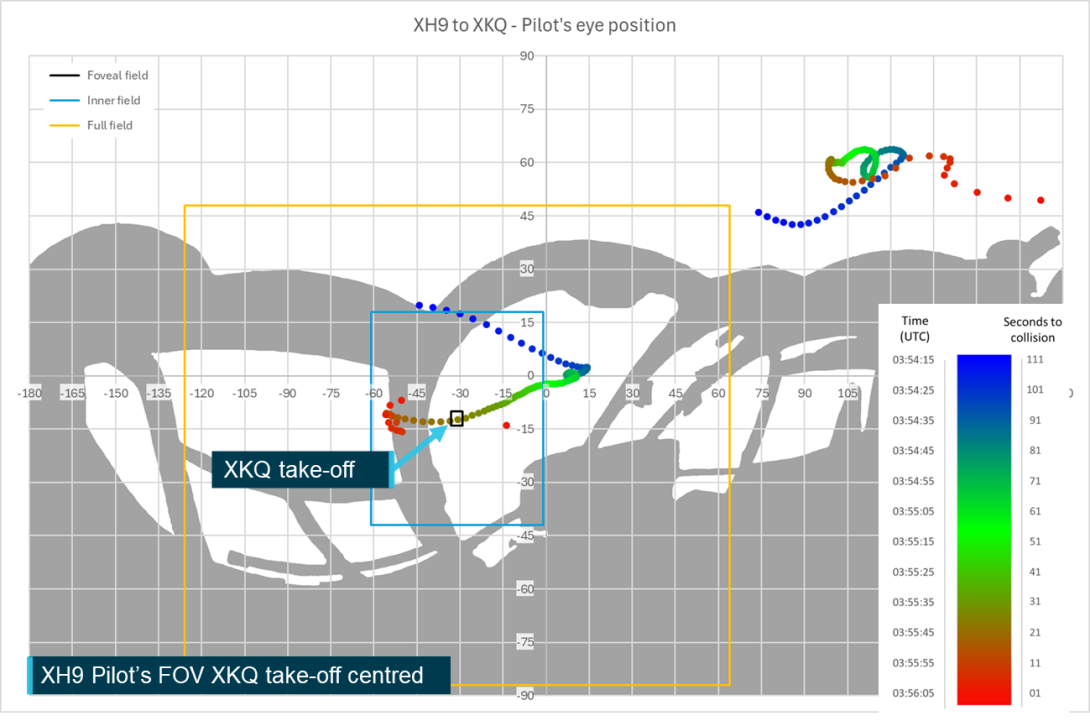
Source: ATSB
In the case the pilot did rotate only their eyes to observe the lifting aircraft into their foveal region the pilot would also have brought a significant section of aircraft structure into the inner region of the FOV limiting their opportunity to detect other threats. As stated in the previous section this only considers the relative position of the aircraft and not the impact of the environment around it. In addition to centring XKQ on the pilot’s FOV, it takes the view further away from the sun, reducing the likelihood of direct or indirect impact of the sun on the pilot’s visual acuity.
XKQ
From the DEP the detectability of XH9 from XKQ will not be affected by rotations of the pilot’s eyes as it remains shielded by cockpit structure throughout the lead‑up to the collision. While the sun was close to the edge of the field of view and glare from the sun may have been impacted by rotations of the pilot’s eyes the presence and position of the pilot’s cap mean that further analysis of the DEP is not required.
As shown in the earlier Sensitivity analysis – eye positionsection there were multiple movements from the DEP that could have reduced the shielding time depending on the position of the pilot’s cap. In this case, the analysis will consider a head position 300 mm forward of the DEP with the cap moved up on the pilot’s head to position it 10° higher than its simulated position. From this eye position XH9 is briefly unshielded for 1 second 15 seconds before the collision and then for a further 9 seconds between 11 and 2 seconds before the collision. At the start of this 9 second window the target aircraft will be 59° to the right of centre and 21° above. The rotation required to centre this point in the foveal region (as shown in Figure 105) would require a head and eye rotation as the horizontal rotation of 59° is greater than the maximum 55° as discussed in XH9 section of the Sensitivity analysis – eye rotation. To facilitate this movement, a tilting or twisting action of the head may be used. This will impact the position of the eyes and subsequently the relative position of the cockpit structure which may alter shielding characteristics. While bringing the target aircraft into the foveal region maximises the detection opportunity a smaller lateral rotation of 20–30° which is within the comfortable range of independent eye movement would bring the target aircraft from the outer field into the inner, increasing the opportunity for detection.
Figure 105: FOV centred on XH9 with eye position forward and cap moved up
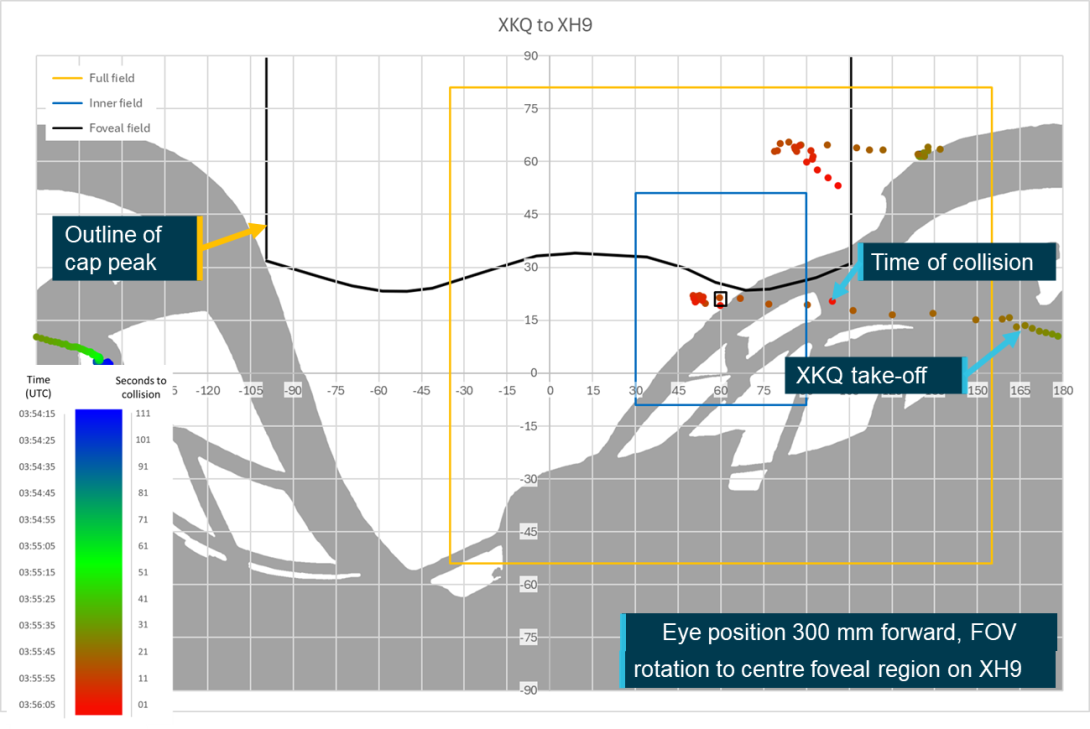
Source: ATSB
Relative movement
Relative movement increases the opportunity for visual acquisition of a target. With the position of the target aircraft tracked across the viewer pilots’ fields of view at constant 1‑second intervals, the speed of angular motion can be determined. For the purposes of the study the angular speed of movement was considered as a combination of the change in azimuth angle and elevation angle every second (Figure 69), which was converted to a value in degrees per second.
Figure 106: Calculation of speed of angular motion
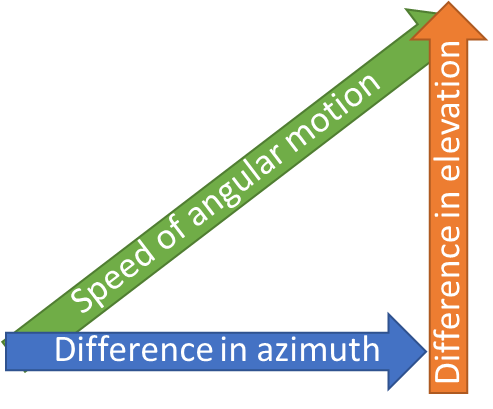
Source: ATSB
As discussed in the Object perception section, relative movement of 0.017–0.034°/ second (1–2 arcminutes/second) can be detected under optimal conditions where the movement is proximal to a stationary reference. A ‘stationary reference’ is considered to exist when the target is within 5° of azimuth or elevation of the cockpit structure.
Where such a reference was not available, 0.17–0.34°/seconds (10-20 arcminutes/ second) was required for detection. For an aircraft, the location of the aircraft structure in the pilot’s visual field will remain constant and so will act as the stationary reference point. As the Aircraft observed positionand Target shielding sections discussed, the aircraft’s position in the visual field at defined intervals was known so its angular speed through the visual field could be calculated.
XH9
During the final 111 seconds leading up to the collision the speed of angular motion of XKQ varied from 0.11°/sec through to 37°/sec. Through the study period XKQ was within 5 degrees of the cockpit structure for 3 of the first 6 seconds, however at this time it would not have been of a detectable size. The relative position of XKQ then transited to the right through the pilot’s windscreen before transitioning back to the left and out to the cockpit pillar. Before passing behind the pillar XKQ is within 5° of the cockpit pillar and unshielded at 03:55:44 and 03:55:45 (22 and 21 seconds before the collision). During the 2 time windows that XKQ appears to the left of the cockpit pillar it remains within 5°, meaning that there is a lower threshold for the detection of movement.
Subsequently to be detectable the angular motion for the remainder of the unshielded time will need to exceed 0.34°/sec. Through the study period there are a total of 10 seconds where the aircraft moves at an angular speed of less than 0.34°/sec. These are in three 3‑second windows starting at 03:54:35, 03:54:49 and 03:54:59, and a single second at 03:55:53. Except for this 1 second, from 03:55:02 the aircraft’s angular movement remains in the readily detectable range improving the likelihood of overall detection. Figure 107 shows the angular speeds over the 111 seconds leading up to the collision.
Figure 107: Angular speed XKQ from XH9
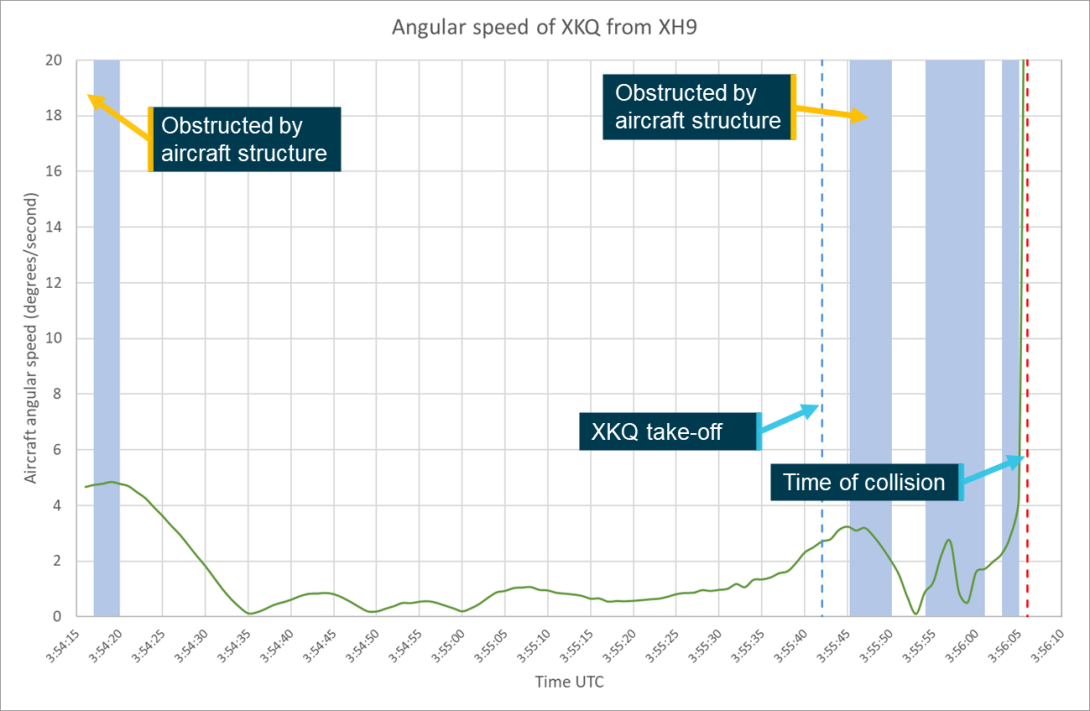
Source: ATSB
Between the time that XKQ lifted from the pad at 03:55:42 and the time it was initially obscured by cockpit structure at 03:55:45, the total angular motion averages 3°/sec which was above the detectable threshold. However, during this period XKQ did not move laterally only increasing height by 5 m. Subsequently there was little to no lateral scene relative movement and so the detection relied on elevational scene relative movement. The elevational speed averaged 0.2°/sec during this time. This movement is theoretically detectable when in proximity of a stationary structure, as it was from 03:55:44, however the target aircraft is only visible for 2 seconds giving a very limited opportunity for the movement to draw the pilot’s attention. Additionally, the cockpit pillar is a vertical structure, and the elevation movement will be parallel to it rather than at an angle or perpendicular. This will mean fewer reference points against which the movement can be sighted and compared to, decreasing the likelihood of detection.
XKQ
During the final 111 seconds leading up to the collision the speed of angular motion of XH9 varied from 0.050°/sec through to 39°/sec. The shielding of XH9 from the pilot of XKQ means that the angular speed provided no opportunity for detection in the 30 seconds leading up to the collision. Figure 108 plots the angular speed of XH9 during the final 111 seconds up until the collision. Shortly after XKQ lifts from the pad there is a significant increase in the angular movement of XH9. This corresponds with the rotation that XKQ completes over the pad, going from facing in towards the south-east to its intended departure track to the south-west. Once XKQ was established on its departure heading and tracking towards the Sea World grass departure point this movement slows as the aircraft track towards one another on relatively stable headings.
Figure 108: Angular speed XH9 from XKQ
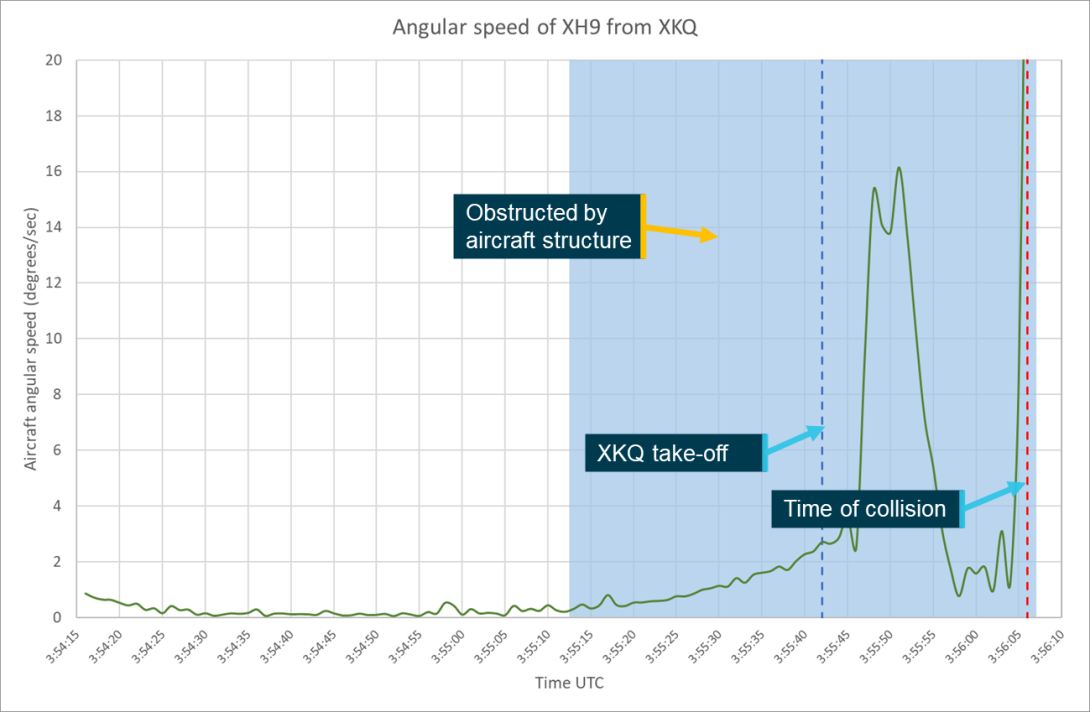
Source: ATSB
Aircraft conspicuity and detectability
Environment
Sun position
Using the Geoscience Australia solar position calculator, the ATSB calculated the relative position of the sun from the location of each helicopter over the final 111 seconds leading up to the collision. Based on this information and treating the sun as the target aircraft and XH9 and XKQ independently as the viewer aircraft the relative position of the sun (in azimuth and elevation angles) from each aircraft was calculated.
Figure 109: XH9 – azimuth and elevation angles to sun
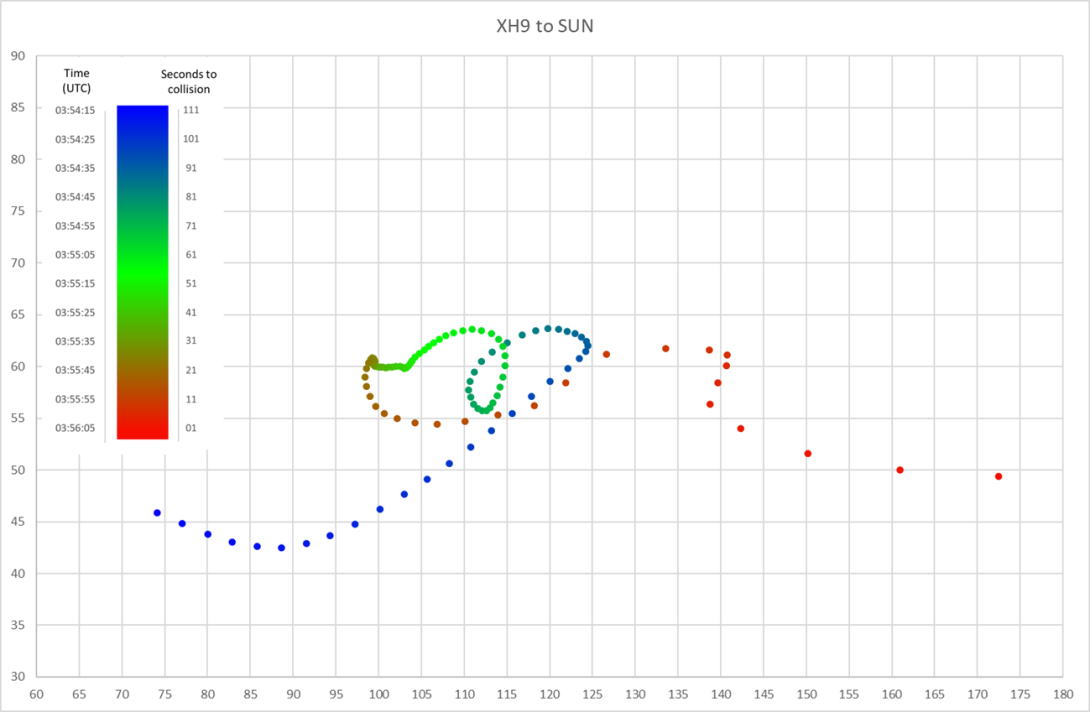
Source: ATSB
Figure 110: XKQ – azimuth and elevation angles to sun
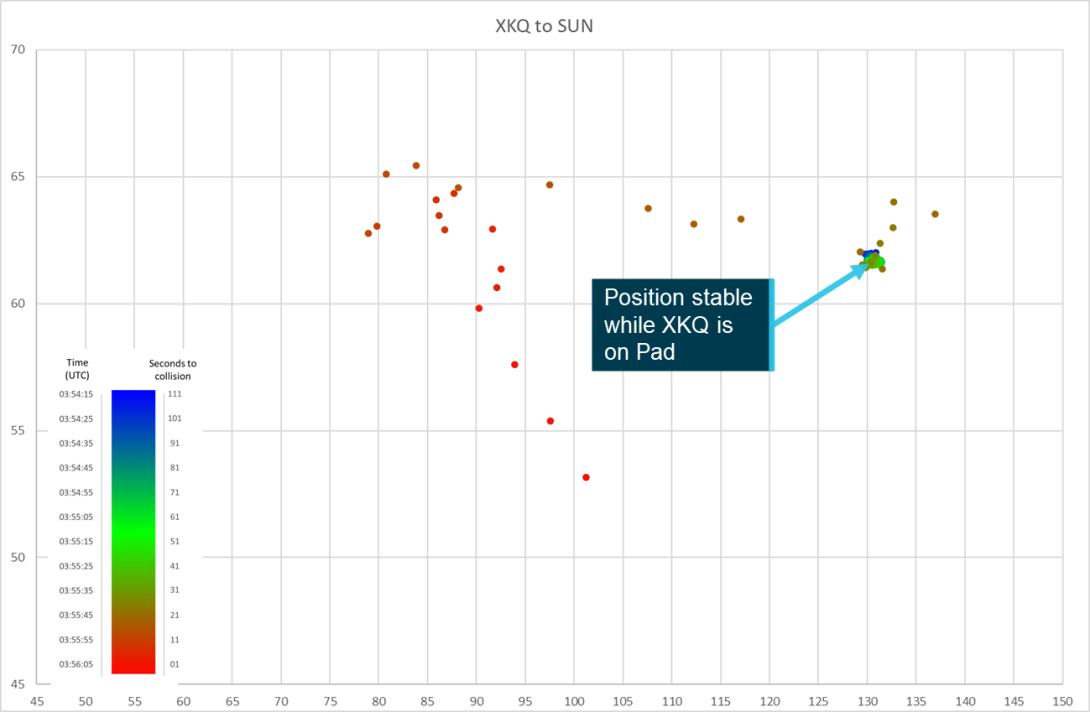
Source: ATSB
To assess the effect of the sun on the pilot it is necessary to determine if the sun will be shielded by the cockpit structure. The impact of the sun on the pilot will be significantly greater where it is unshielded or at the edge of a shielded area as it will induce glare to the pilot reducing their ability to detect other objects. To determine when the sun will be unshielded to the pilot the azimuth and elevation angles to the sun’s position are plotted over the equirectangular view from the pilot’s position developed inPoint cloud conversion.
Due to the time of day and year that the accident occurred, the general position of the sun was near directly above both aircraft.
Figure 109 shows the relative position of the sun from XH9’s pilot with the sun unobstructed through the aircraft’s left skylight, directly above the pilot. As shown in the Field of view analysis section, with the pilot’s view centred, it will not be directly in view for more than 100 seconds before the collision, transiting to the right, away from the visual field. As the sun remains unshielded, the pilot will be subjected to some glare which may impact their visual acuity, however this will reduce the further away from the visual field that the sun moves. The addition of the surface coating (see Aircraft information) that was applied to the skylights will reduce this effect, further providing intermittent shielding to the pilot and reducing the impact of the sun on their visual acuity. Video footage from inside the aircraft showed that in the 12 seconds leading up to the collision the sun was on the pilot. The relative position and orientation of the pilot’s head effectively shades the face from the sun until approximately 5 seconds before the collision when the head is rotated to the right, away from the approaching aircraft. At this point the sun can be seen to illuminate the pilot’s face but with their eyes still shaded by their sunglasses.
Figure 110 shows the relative position of the sun from XKQ’s pilot. At no time during the 110 seconds leading up to the collision is the sun shielded by the cockpit structure. The sun position remains effectively stationary to the view of the pilot of XKQ until the time that XKQ lifts from the pad. The relative position of the sun starts to change noticeably 6 seconds after XKQ lifts from the pad and then starts its transit south towards the Sea World grass departure point. With the pilot’s view centred, based on the ATSB’s rectangular FOV, the sun would briefly appear on the upper right extremity of the pilot’s FOV in the second before the collision and would be proximal to the edge of visual field from shortly after XKQ starts its transition towards the Sea World grass departure point.
If the pilot was looking directly ahead this would have increased the glare from this area of the visual field reducing the pilot’s ability to detect the target aircraft particularly as it is approaching from the direction and in the same quadrant of the visual field that the sun is positioned. The pilot’s cap will provide a significant benefit in reducing the impact of the sun. The cap will provide physical shielding from the direct impact of the sun when in or at the edge of the visual field to the edges of the cap’s peak. Figure 113 shows the position of the sun with the outline of the pilot’s cap peak overlaid.
Figure 111: XH9 pilot – relative position of sun
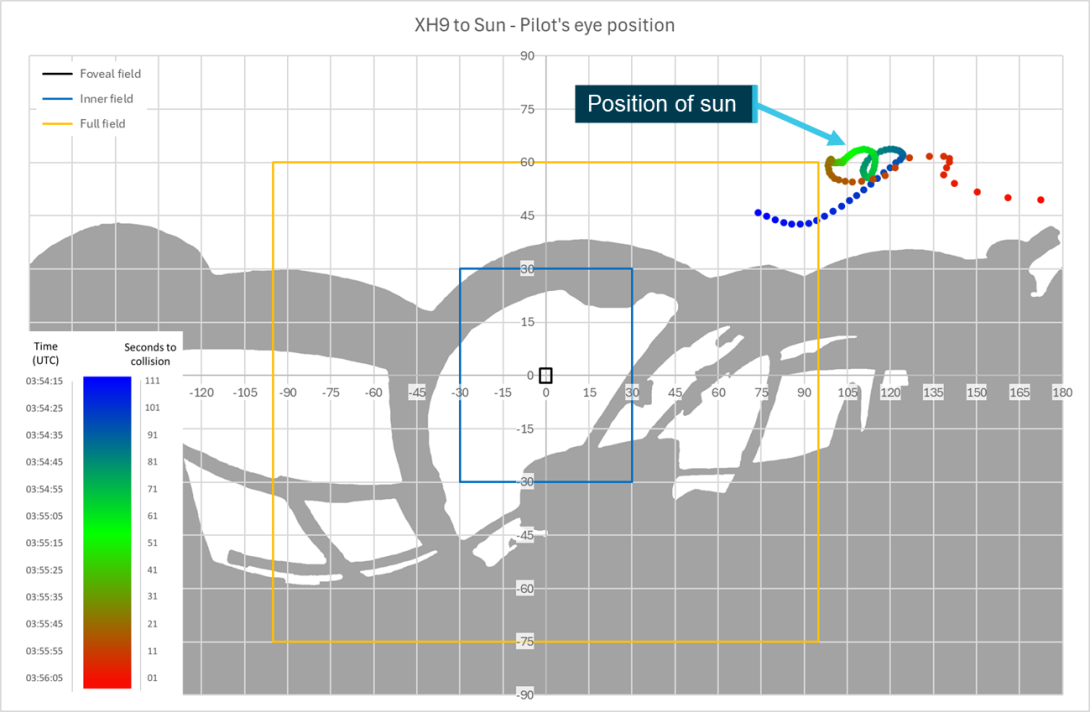
Source: ATSB
Figure 112: XKQ pilot – relative position of sun
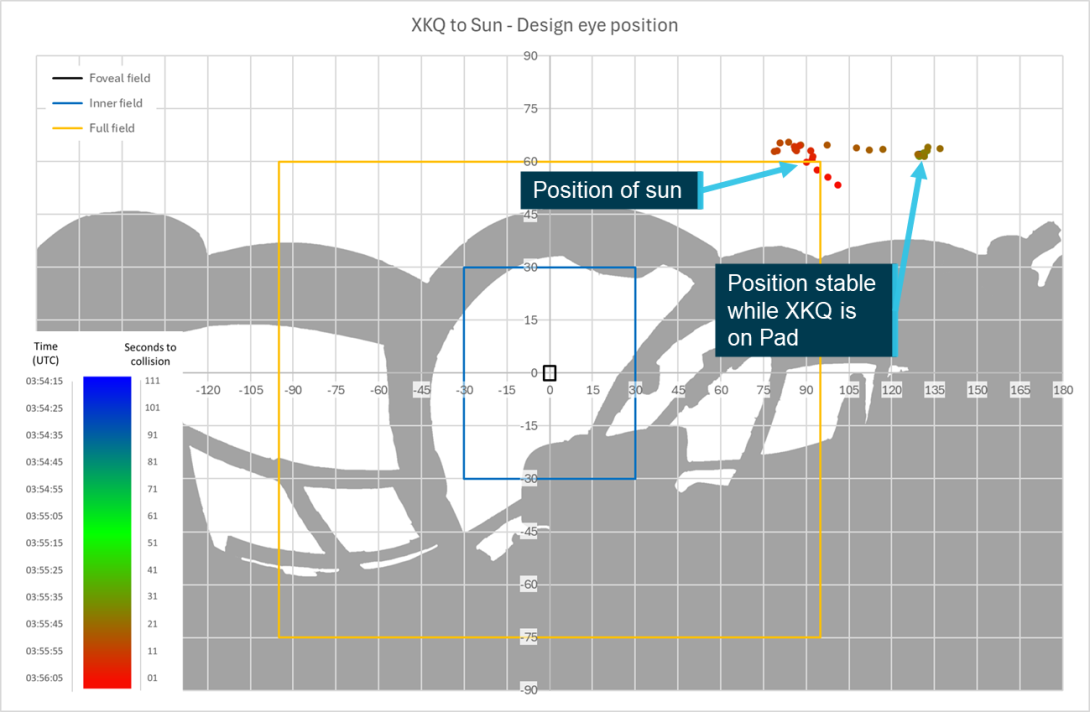
Source: ATSB
Figure 113: XKQ pilot – cap sun shielding
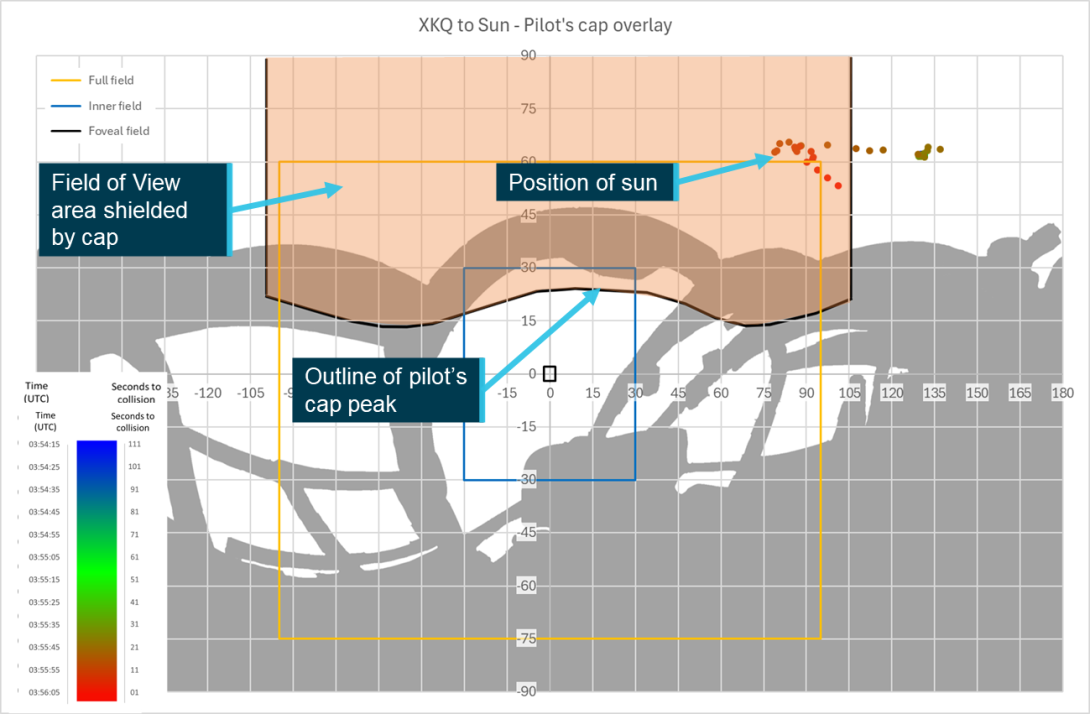
Source: ATSB
Overall, the high relative position of the sun to both pilots means that, while unlikely to impact their vision directly, glare through the skylights could have impacted visual acquisition opportunity. Both pilots were wearing sunglasses which would have further assisted in limiting any adverse impacts of the sun in the lead‑up to the collision.
Aircraft
Lighting
Both XH9 and XKQ were fitted with position, anti-collision, landing and approach lights, of various types and rated output powers. Lighting can be one of the most effective methods for assisting in detection of an aircraft by drawing the attention of the viewer. The effectiveness of lighting on detectability of an aircraft will be controlled by 4 factors:
- The relative position and orientation of the 2 aircraft.
- The geometry and illumination characteristics of the light.
- The environment within which the light is being used for detection.
- The location in which the light appears to the viewer.
Where actual values for lighting intensity are available these are used, however as discussed in the Aircraft information section the manufacturer was only able to advise that position and beacon lights met the specification in the regulations. For these cases the regulation specification will be used to present a worst-case scenario, where lighting was more powerful this could have potentially improved detectability.
XH9
For a light to aid in the detection of an aircraft it must first be able to be seen by the viewer. As presented in the Target shielding section, XH9 was unshielded from the pilot’s eye position of XKQ until 03:55:12 and appeared through the rear left window of XKQ. While it is unlikely that XH9 would have been of a detectable size at this time the approach and landing lights, mounted to the underside of the helicopter, may have provided an opportunity for detection had they been active. XH9’s landing light had an intensity of 310,000 cd and beam spread of 15° horizontal and 10° vertical; it was sloped back at an angle of approximately 15° from the fuselage. The taxi light had an intensity of 15,000 cd and beam spread of 40°, it was recessed into a housing and sloped back at an angle of 30° from the fuselage. There will likely be some spill of the beam outside of these limits, but the stated intensities apply to the central beam and subsequently detectability of the spill cannot be assessed.
For the light to be detectable it must be directed at the viewer, as the approach and landing lights are secured to the body of the helicopter the lateral angle that the light is on will be approximately equal to the heading of the helicopter. The vertical angle of the light will be equal to the pitch angle of the helicopter minus the angle between the light and the aircraft’s fuselage.
Where the lateral angle and vertical angle, minus the angle of the light, from XH9 to XKQ, as calculated in the Aircraft observed position section, is positioned within the beam spread of the lights it can be assumed that the light is directed at the other helicopter. Between 03:55:01 and 03:55:12 XH9 was directed towards XKQ, however the declination angle of the lights from the fuselage meant that central beam of neither the landing nor approach lights would have been directed at XKQ on the pad.
The intensity of the position and beacon lights of XH9 meant that while unshielded from the pilot’s eye position of XKQ, none of these lights would have provided an opportunity for detection.
XKQ
XH9’s initial track, coming from above and behind XKQ meant that the taxi and landing lights would not have been visible, and XH9 would have initially been presented with the rear position light and anti-collision beacon of XKQ. Once XH9 had passed XKQ and XKQ was approaching from the left, the right position light and beacon would have been presented to XH9.
As discussed in Aircraft Information the rear position light was required to have a minimum intensity of 20 cd and the right position light was required to have a minimum intensity of 5 cd between 20° and 110°. The tail beacon had a minimum required intensity of 150 cd which was reduced to 15 cd between 20° and 30°.
Based on the geometry of XH9’s approach, XKQ’s rear position light would have been visible to the pilot of XH9. At 03:55:50, 16 seconds before the collision, XH9’s relative position passed forward of 110° from XKQ’s centreline meaning that the right position light would have been visible to the pilot, however at the lowest required brightness. At no point is XH9 less than 20° from the centreline of XKQ and subsequently no more than 5 cd is the required intensity. The positioning of XKQ’s anti-collision beacon high on the tail means that it is visible to the pilot of XH9 throughout the approach when XKQ is not shielded by structure. The intensity requirements for this light varies by the elevation angle from which it is detected. At approximately the time that XKQ lifts off the park pad the elevation angle from XH9 is between −10° and −20°. The intensity of lighting required for this range of angles is 30 cd. Figure 114 shows XKQ lifting from the park pad from the footage aboard XH9 with the location of position and anti-collision beacon lights identified.
Figure 114: Footage of XKQ departing the park pad from on board XH9
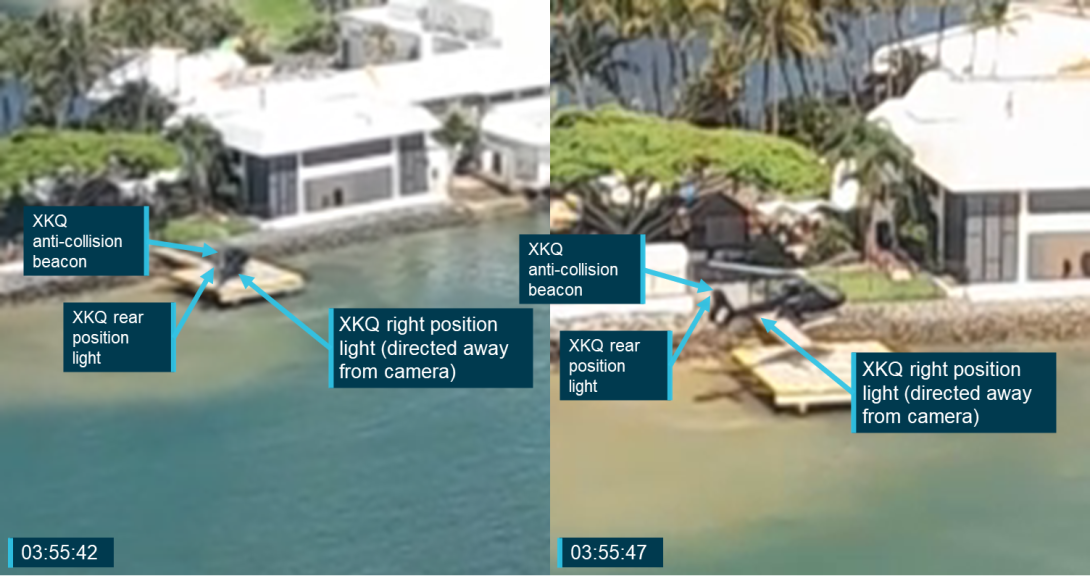
Source: Supplied, annotated by the ATSB
At the time that XKQ departs the pad the aircraft are approximately 450 m apart. Based on the inverse square relationship it can be assumed that a light with an output 100 times less powerful than that plotted in Figure 22, for a background luminosity of 3,000 cd/m2, would be detectable. Subsequently within the foveal region a light of more than 45 cd would be required and approximately 3,000 cd 10° into the periphery.
Between 03:55:50 and 03:55:54, as XKQ climbs towards XH9 the vertical angle between the 2 aircraft decreases to between 8° and 10°. For most of this time XKQ is unshielded outside of the left cockpit pillar and between 300 and 250 m from XH9. Between 5° and 10° from the horizontal the beacon light is required to have an effective intensity of 90 cd. At 250 m this intensity is within the detectable range for foveal vision, but still well below the 600 cd required 10° into the periphery.
The position lights of XKQ were positioned on the end of the horizontal stabilisers meaning that the background of the light was the dark grey horizontal stabiliser. However, at distance the light will need to be detected against the helicopter’s background as shown in Figure 114. Alternately as the tail beacon is required to have 360° visibility, from most angles except directly above or above and behind, the light will need to be detected against the background.
The detectability of XH9’s tail beacon 4 and 3 seconds before the collision, is shown in Figure 115 which consists of 2 still frames from video footage on board XKQ when the aircraft were between 100 and 75 m apart. While XH9 was not visible to the pilot at this time the images show the complexity of detecting lights, of this power, against a light background.
Figure 115: Footage of XH9 on approach from passenger of XKQ
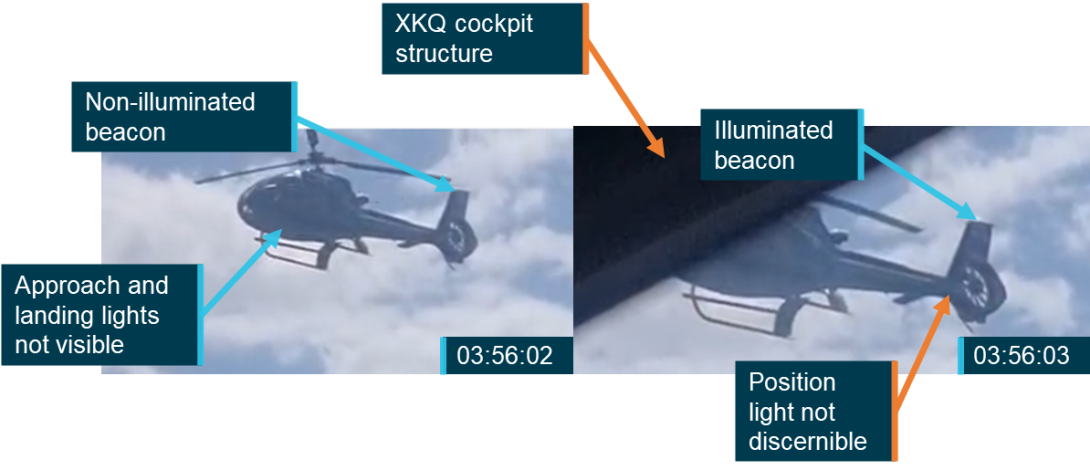
Source: Supplied, annotated by the ATSB
From the information presented in Aircraft observed position following its departure from the pad XKQ continues to transit towards the left away from the foveal and inner FOV and to the outside of the cockpit pillar. Subsequently even at the reduced distance between the 2 aircraft, the low required intensity of these lights mean that they would have had a minimal, if any, impact on the ability of the pilot of XH9 to have their vision drawn to or detect XKQ.
High‑visibility rotor blades
The utilisation of patterned or high‑visibility rotor blades can allow for increased visibility of a helicopter when viewed from above. XH9 as presented in the Aircraft information section was fitted with these blades. Due to the approach angle between the 2 helicopters the top of the rotor disk of XH9 would not have been presented to the pilot of XKQ at any point during the approach, subsequently there was no opportunity for conspicuity to be increased using these rotor blades.
XKQ was not fitted with high‑visibility rotor blades, nor was it required to be. However, the Aircraft observed position section and video footage from on board XH9 show that the rotor disc of XKQ was presented to the pilot of XH9 during the approach sequence and could have been used as an indicator that XKQ was airborne when not shielded. The concentric circles created by the high‑visibility rotor blades would have provided increased contrast for the disc itself and potentially with the background. This would have increased the likelihood of the pilot of XH9’s attention being drawn to XKQ’s lifting off the pad.
Paint schemes
Both XH9 and XKQ were painted dark grey with lighter grey markings used for relevant branding and other markings, such as registration. The body colour would be likely to contrast against lighter coloured backgrounds such as a blue sky, white buildings, or clouds. However, against complex or darker backgrounds such as water, shaded environments, or suburban environments the body of the aircraft would be harder to detect. Figure 116 shows XKQ as viewed from the passenger of XH9 at 03:55:53 (13 seconds before the collision). It shows the conspicuity limitations of the colour of the paint scheme against the shaded background of the park.
Figure 116: Footage of XKQ departing the park pad showing lack of background contrast
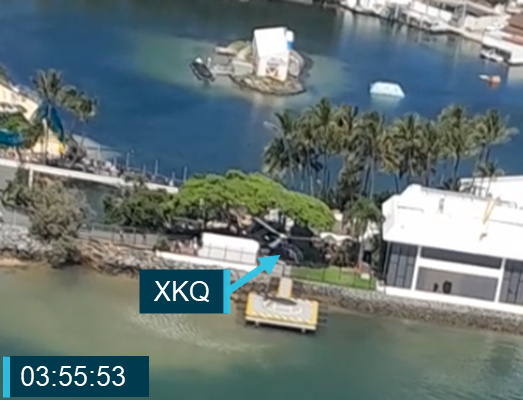
Source: Supplied, annotated by the ATSB
Contrast
Where there is significant contrast between 2 elements, vision is naturally drawn towards this increasing the opportunity for detection.
XH9
XKQ becomes a threat to the pilot of XH9 once it departs the park pad, at 03:55:42. For 3 seconds from the time of departure, for 4 seconds from 03:55:51 (15 to 12 seconds before the collision) and a further 2 seconds from 03:56:02 (4 seconds before the collision) XKQ is unshielded to the pilot of XH9. It was determined that due to the number of variables involved and limitations on the data available a quantitative contrast assessment would not provide reliable results. However, based on footage from on board the aircraft a qualitative assessment was completed looking at the contrast between the aircraft and its background during the first 2 time-windows that XH9 was unshielded after take-off. The third time‑window from 03:56:02 has been discounted as at this time there was insufficient time for the pilot to react and avoid the collision, refer to Reaction time.
Video footage taken by the rear left passenger of XH9 captured XKQ from lift‑off from the park pad until the collision showing both the aircraft and its background. There are 2 important qualifiers that need to be noted as part of this analysis. Firstly, the camera position is approximately 0.5 m aft and below where the pilot’s head was. Due to the angular difference this induces, this will have an impact on the background against which the aircraft is seen. Secondly, the camera image is not a true representation of the colourisation or luminance that the pilot would be seeing for the following reasons:
- The target aircraft is viewed through a tinted section of the window, which will affect the both the luminance and the colourisation of the target and the background.
- The camera is attempting to compensate for the darkened view through the tint by increasing the exposure, note the overexposed sandbar and buildings as seen through the windscreen.
- The internal structure of the aircraft is being reflected in the window further altering the colour perception of both the target and the background. The impact of this on colour and luminosity will vary as the reflection is not uniform across the window.
- The pilot is wearing sunglasses which as discussed in the sunglasses section will impact their perception of the colourisation and luminance of the outside environment.
Figure 117 shows the view from the camera looking forward showing the difference between the untinted windscreen and the tinted left windows.
Figure 117: Camera footage from XH9 03:55:14 showing window and visibility of XKQ
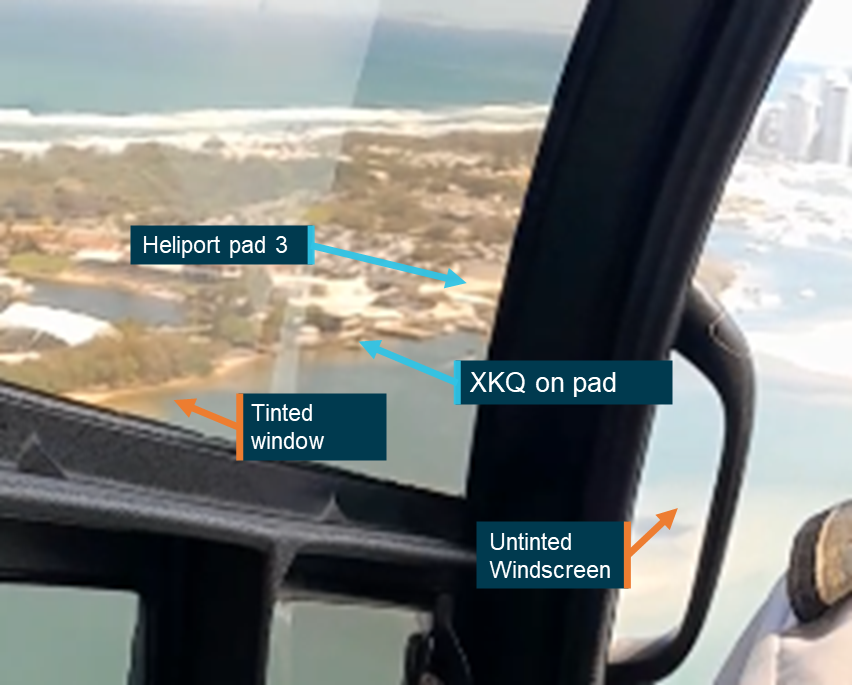
Source: Supplied, annotated by the ATSB
Figure 118 shows a series of clipped images from footage captured on board XH9 between 2 seconds before XKQ departs the park pad until 3 seconds after (03:55:45), identified as the time that XKQ would have passed behind the cockpit structure of XH9 and been shielded from the view of the pilot of XH9. The darkened colour of the helicopter blends in with the seawall behind the helicopter. The lower half of the helicopter is more visible against the lighter coloured concrete of the helipad, however there is not a significant contrast that would be likely to draw the attention of a viewer who is otherwise focused. The series of images also demonstrates the difficulty that the pilot of XH9 would have had in detecting XKQ lifting from the pad and its subsequent change in threat status.
Figure 118: Footage from on board XH9 showing the relative contrast between XKQ and its background throughout its departure
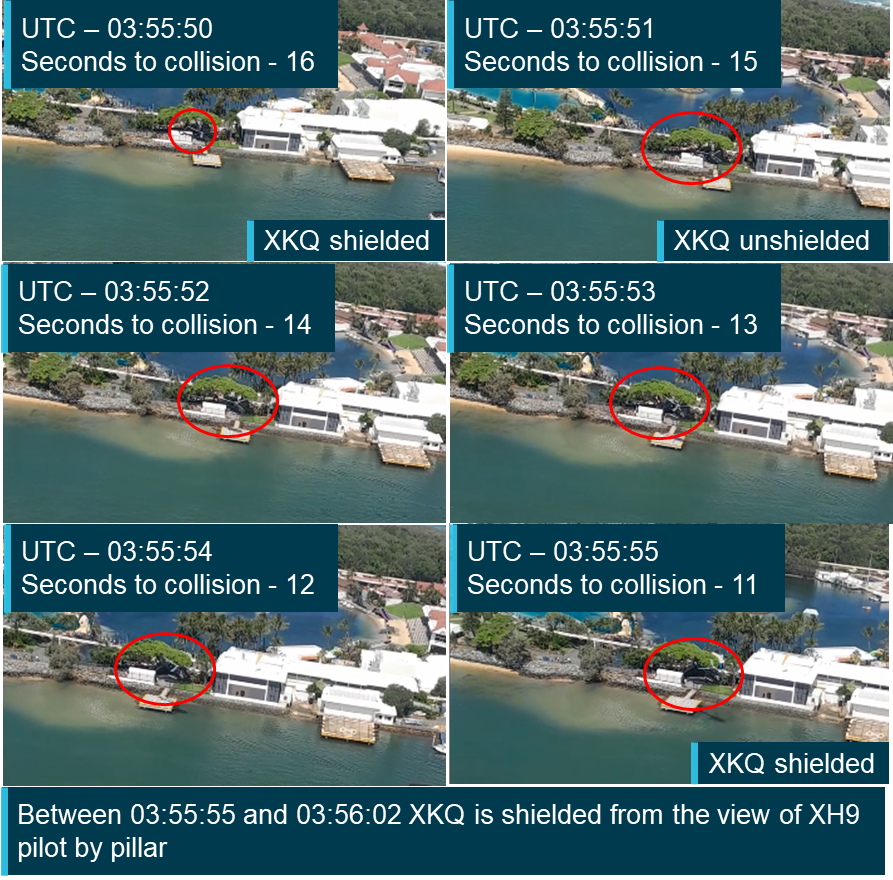
Note: The images shown are freeze‑frame, and do not show the impact of movement of either the aircraft or the spinning rotor blades (which were not coated with a high‑visibility paint scheme) on the opportunity for detection. Source: Supplied, annotated by the ATSB
Figure 119 shows the view from the camera at 1‑second intervals between 03:55:50 and 03:55:55. For 4 of these 6 seconds the aircraft would likely have not been shielded from the pilot of XH9 appearing outside the left cockpit pillar. From the camera’s viewpoint the aircraft is sighted primarily against the shaded background of the trees behind it. Initially the aircraft’s tail boom and fenestron contrasts with the white building directly behind it. However, as the aircraft continues to climb, the boom and fenestron move above the building and are also sighted against the shaded background limiting the available contrast to aid detection.
Figure 119: Footage from on board XH9 showing the relative contrast between XKQ and its background for the 4 seconds that it was unshielded between 03:55:51 and 03:55:54
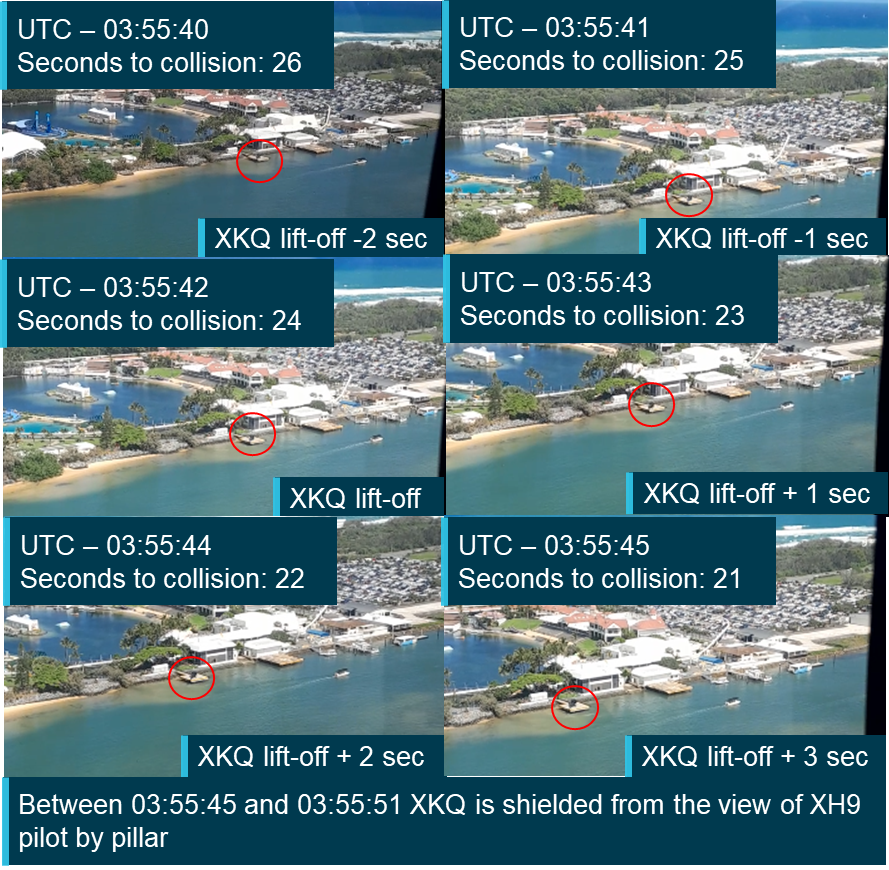
Note: The images shown are freeze‑frame, and do not show the impact of movement of either the aircraft or the spinning rotor blades (which were not coated with a high‑visibility paint scheme) on the opportunity for detection. Source: Supplied, annotated by the ATSB
For comparison, Figure 120 was taken at 03:55:57, 15 seconds after XKQ lifts from the pad. At this time the aircraft is shielded from the pilot of XH9 by cockpit structure. During this transit XKQ passes in front of a white building. This image demonstrates the significant impact contrast can have on the detectability of the target. The dark parts of the helicopter that are seen against the white of the building, notably position 1, are very easy to detect and could draw the attention of the viewer, particularly combined with the movement of the aircraft. The parts of the helicopter seen against the darker surfaces at positions 2 and 3 are much more difficult to locate and would provide less visual detection opportunity.
Figure 120: Footage from on board XH9 showing XKQ transiting across a high contrast background
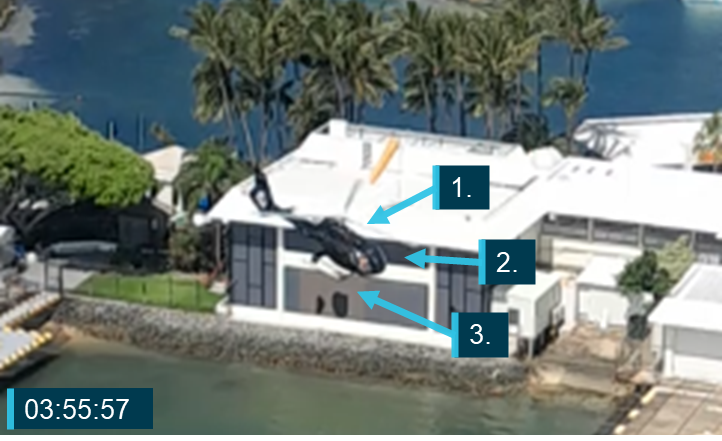
Source: Supplied, annotated by the ATSB
It is also important to note that XKQ was not fitted with high‑visibility rotor blades, which create the appearance of concentric circles on the rotor disc, this provides an additional element that can contrast either with the colour of the helicopter or the background depending on the viewing angle.
XKQ
While XH9 was likely shielded from the pilot of XKQ the contrast between XH9’s darker coloured paint scheme and the blue or light (white) clouds behind it meant that there was an increased contrast with the background. Figure 121 shows footage of XH9’s approach taken from onboard XKQ 7 seconds before the collision. It shows the effect of this combination and how this could improve the opportunity for detection.
Figure 121: Footage from on board XKQ showing the relative contrast between XH9 and its background
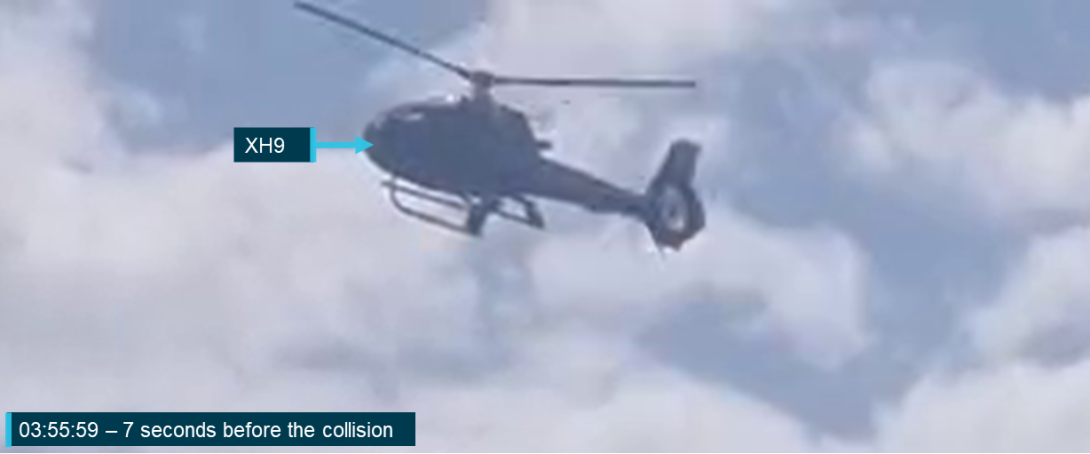
Source: Supplied, annotated by the ATSB
Assessment
As was shown in the cockpit visibility section from 32 seconds before they departed the park pad XH9 would have been shielded from the pilot’s eye position of XKQ by cockpit structure. Prior to this the landing and approach lights on XH9 were not directed at XKQ and these lights were switched off. Subsequently avoidance of the collision required the pilot of XH9 to visually identify the change in status of XKQ at or after the time it lifted from the park pad. This section has considered the aircraft specific factors that could have influenced the likelihood of detection.
While XKQ was positioned on the park pad its dark colour scheme contrasted with the lighter coloured concrete of the pad, against which the pilot of XH9 would have been seeking to detect it. For the time that XKQ was airborne prior to its transition behind the left cockpit pillar of XH9 (03:55:42 – 03:55:47), it continued to be sighted against the lighter colour of the park pad. However as shown by the on board footage and the Scene relative movement analysis the initial vertical movement of the aircraft would have been difficult to detect even against this lighter coloured background. At the next time that XKQ was unshielded from the pilot of XH9 between 03:55:51 and 03:55:54 the aircraft is now sighted against a more complex background with reduced contrast to the aircraft’s colour scheme and subsequent reduction in detection opportunity. During this time XKQ’s tail beacon may have been sufficiently bright to be detected, but only if the pilot was looking directly at it. Neither it nor the aircraft’s other visible lights were bright enough against the background luminosity to draw the pilot’s attention outside of the cockpit structure. Shortly after this (03:55:57) XKQ transitioned into forward flight and was shielded again from the view of the pilot of XH9. At this time, it passed in front of a white building against which the dark colour scheme of the helicopter would have provided a significant contrast and subsequently increased the likelihood of detectability.
The implementation of hi-visibility blades on XKQ could have aided the pilot of XH9 in locating and having their attention drawn to XKQ during the times that it was likely unshielded, particularly where this could have increased contrast with the background.
Animation development and results
Animation development had 2 key roles in supporting this study. The first was, as discussed in the Aircraft position and orientationsection, to verify the flight data, aircraft and pilot’s positions through a comparison with onboard recorded video footage. The second was in the development of a realistic simulation of the accident scenario and what would and would not have been visible from the pilot's eye position in the aircraft. This was to provide investigators, involved parties and the wider community with a better understanding of the limitations of conspicuity from these 2 aircraft in the accident scenario. The development of the animation was an iterative process; as information was refined and updated additional versions of the animation were produced. The following sections will discuss the information used through the animation’s development and then present results of the finalised version of the animation which represents the ATSB’s best estimation of what the pilots of the 2 aircraft would have been able to see if located in the pilot's eye position and looking directly ahead.
Animation development
The animation supporting the visibility study was developed through a collaboration between the ATSB, Airbus Helicopters and IWI. The collaboration was facilitated through an accredited representative from Bureau d'Enquêtes et d'Analyses pour la sécurité de l'aviation civile (BEA) (France) in accordance with ICAO Annex 13.[25] Using the methods discussed through this report, the following information was analysed and refined. It was then used by IWI as the basis for the animation that was produced for the ATSB.
- Corrected and verified flight data including aircraft position and orientation parameters, based on video footage
- 3D point cloud model of the exemplar aircraft
- refined design and pilot eye positions
- meteorological information for the day of the accident
- terrain information for the area around the accident site
- aircraft configuration and fitment
- pilot of XKQ’s hat.
The animation was initially developed in an interactive tool that allowed the viewer to adjust both the eye point and the field of view. This functionality was used to support the assessments made in both the eye position and rotation sections of the Sensitivity analysis. It allowed investigators to understand what the effects of these movements would have been in a simulated scenario and how the pilots may have increased the chances of visual detection.
The ATSB’s point cloud model of XKK has been used to represent the cockpit structure of the viewer aircraft, replacing the virtual model from the animation software. The replacement was made as the dimensional accuracy of the virtual model in the animation software could not be assured and utilisation of the point cloud model aligned the animation with the analysis performed in this study that uses the point cloud representation of the aircraft.
The ATSB analysis and the IWI animation were produced using separate tools and processing techniques. To transfer relevant information between the systems, calibration was required. The calibration process required the manual selection of points in each model followed by visual alignment of position and rotation. The alignment was able to be completed to an accuracy of approximately 15 mm. Additionally the ATSB technique used a 2D projection of the point cloud compared to the 3D view shown in the animation. The positional accuracy between the 2 analyses aligns within one second. It was determined that to introduce any further correction to either analysis risked introducing errors due to the relative position of the eye point and aircraft structure. Due to the distances and positional accuracy involved this change only had limited impact on most of the analysis. The only significant change that was introduced was the potential for an additional window of time where XKQ could have been partially or fully unshielded outside of the left cockpit pillar from the pilot’s eye position of XH9 between 6 and 5 seconds before the collision.
Passengers have been included in the animation to increase realism and show what effect they could have on the visibility of the pilot. As identified in the analysis, the location of passengers did not at any point during the animated section of the flight shield the other aircraft from view.
Due to the data processing requirements in the development of the animation, only the final stage of each flight was animated. The animation commences at 03:55:27, 15 seconds before XKQ departs the park pad showing the views from both helicopters through to the time of the collision.
Animation results
The full animation representing the pilot’s view from each aircraft in the lead‑up to the collision is available on the ATSB website. The following figures present the animation of the pilots’ view at key points in the accident sequence showing relative location and detectability of the target aircraft. Each shows a 120° by 70° section of the FOV. A red circle in each image represents relative location of the target aircraft.
XH9
The following figures show the view looking ahead from the pilot’s eye position of XH9 at a number of points in the lead‑up to the collision. In images where XKQ appears behind the cockpit structure the transparency of the cockpit mask has been reduced so that the viewer can identify the aircraft where it is shielded by the structure. Table 5 shows the figure numbers of the images of the lead‑up to the collision and where these images fit in the sequence.
Table 5: XH9 animation approach figures
| Figure Number | Time (UTC) | Time to collision | Notes |
Figure 122 |
03:55:30 | 36 seconds | Initial view of the animation |
| Figure 123 | 03:55:42 | 24 seconds | XKQ lifts from the pad |
| Figure 124 | 03:55:45 | 20 seconds | XKQ transits behind cockpit structure |
| Figure 125 | 03:55:47 | 19 seconds | XKQ shielded by cockpit structure |
| Figure 126 | 03:55:51 | 15 seconds | XKQ to the left of the cockpit pillar |
| Figure 127 | 03:55:56 | 10 seconds | |
| Figure 128 | 03:55:57 | 09 seconds | Pleasure craft shielded by cockpit structure |
| Figure 129 | 03:56:00 | 06 seconds | Upper bound limit of time for pilot to detect aircraft and react and manoeuvre to avoid collision |
| Figure 130 | 03:56:01 | 05 seconds | |
| Figure 131 | 03:56:03 | 04 seconds | Lower bound limit of time for pilot to detect aircraft and react and manoeuvre to avoid collision |
| Figure 132 | 03:56:04 | 03 seconds | Insufficient time to manoeuvre |
| N/A | 03:56:06 | 0 seconds | XKQ and XH9 collide |
Figure 122: View from XH9 36 seconds before collision
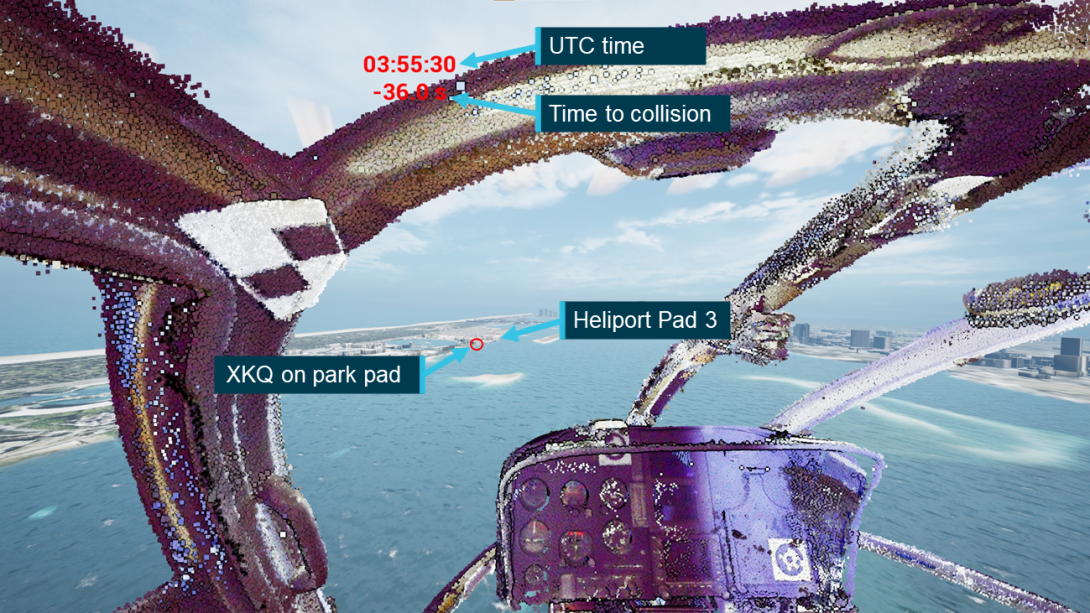
Source: IWI, annotated by the ATSB
Figure 123: View from XH9 24 seconds before collision
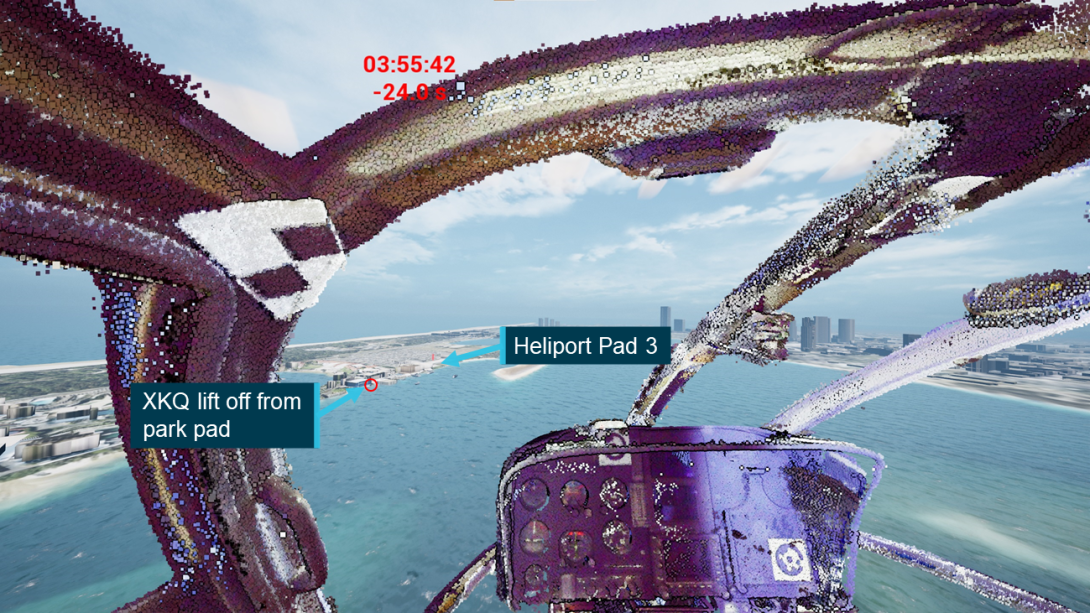
Source: IWI, annotated by the ATSB
Figure 124: View from XH9 21 seconds before collision
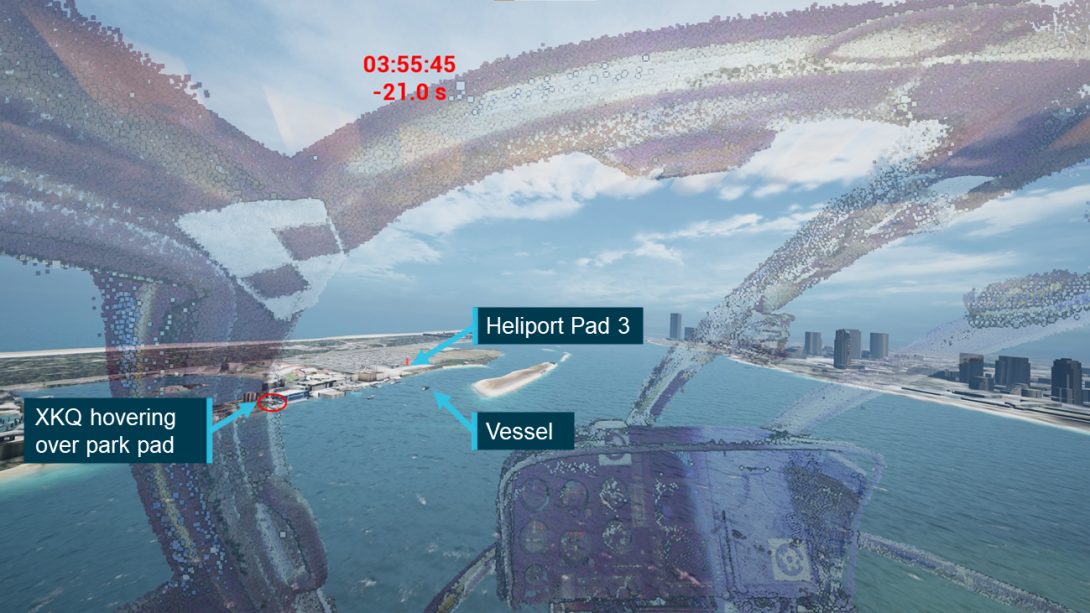
Source: IWI, annotated by the ATSB
Figure 125: View from XH9 18 seconds before collision
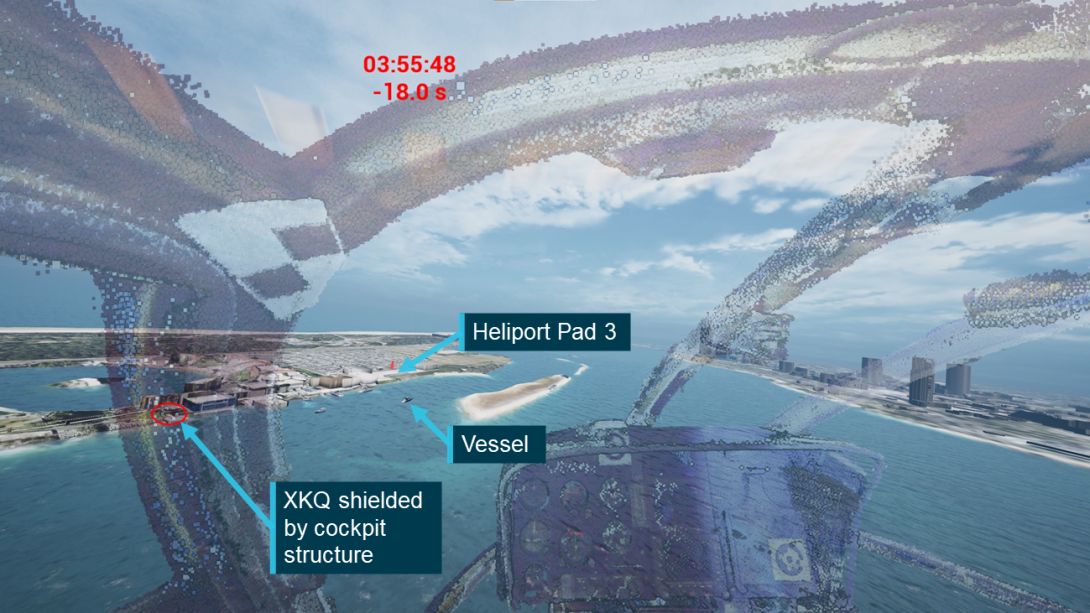
Source: IWI, annotated by the ATSB
Figure 126: View from XH9 15 seconds before collision
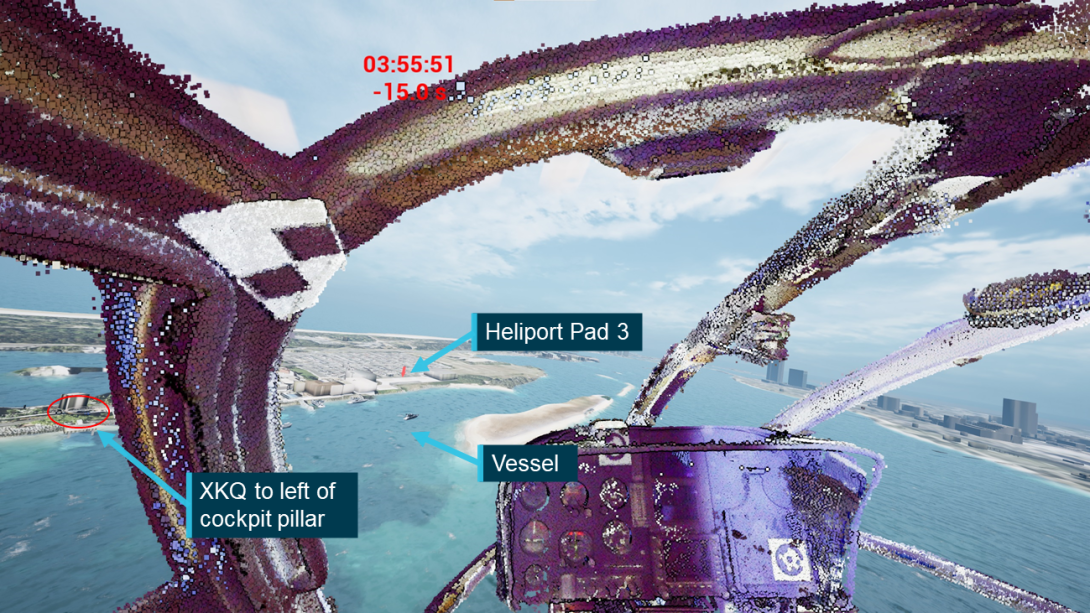
Source: IWI annotated by the ATSB
Figure 127: View from XH9 10 seconds before collision
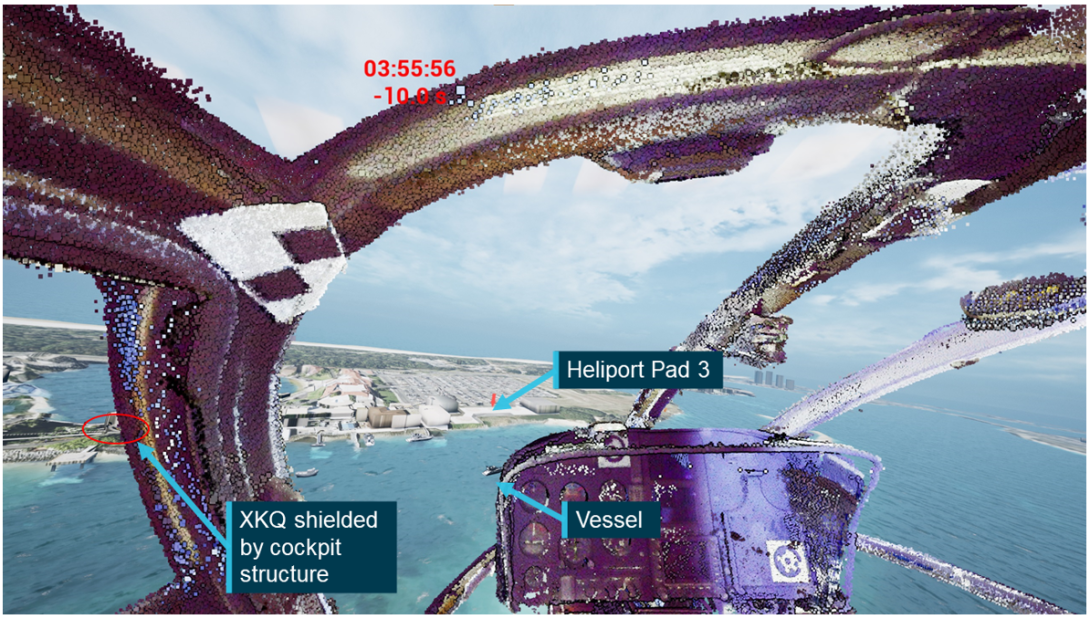
Source: IWI, annotated by the ATSB
Figure 128: View from XH9 9 seconds before collision
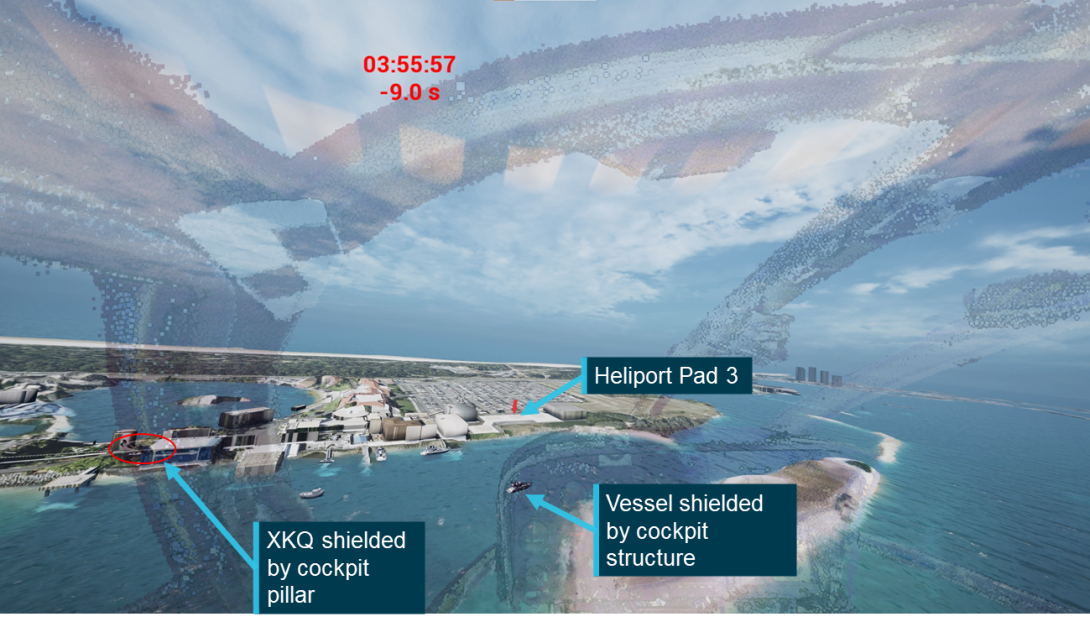
Source: IWI, annotated by the ATSB
Figure 129: View from XH9 6 seconds before collision

Source: IWI, annotated by the ATSB
Figure 130: View from XH9 5 seconds before collision
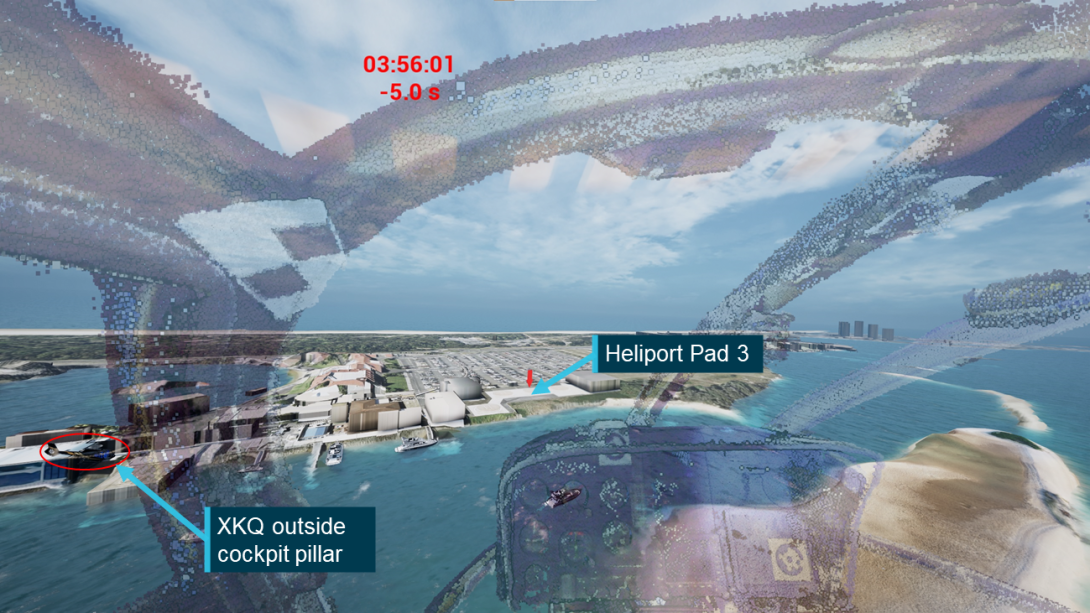
Source: IWI, annotated by the ATSB
Figure 131: View from XH9 4 seconds before collision
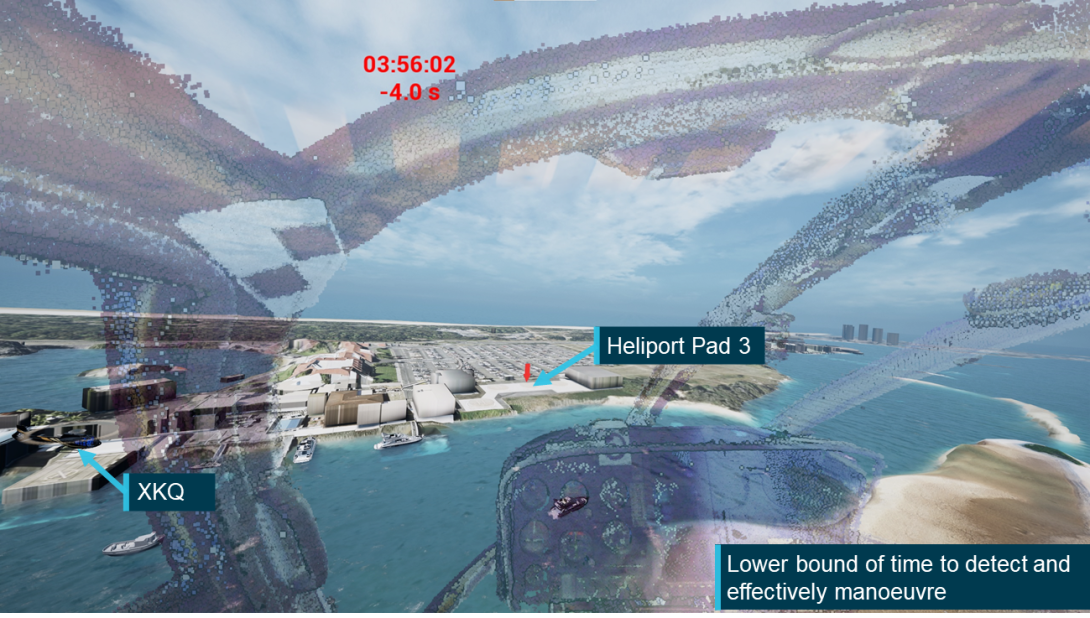
Source: IWI, annotated by the ATSB
Figure 132: View from XH9 3 seconds before collision
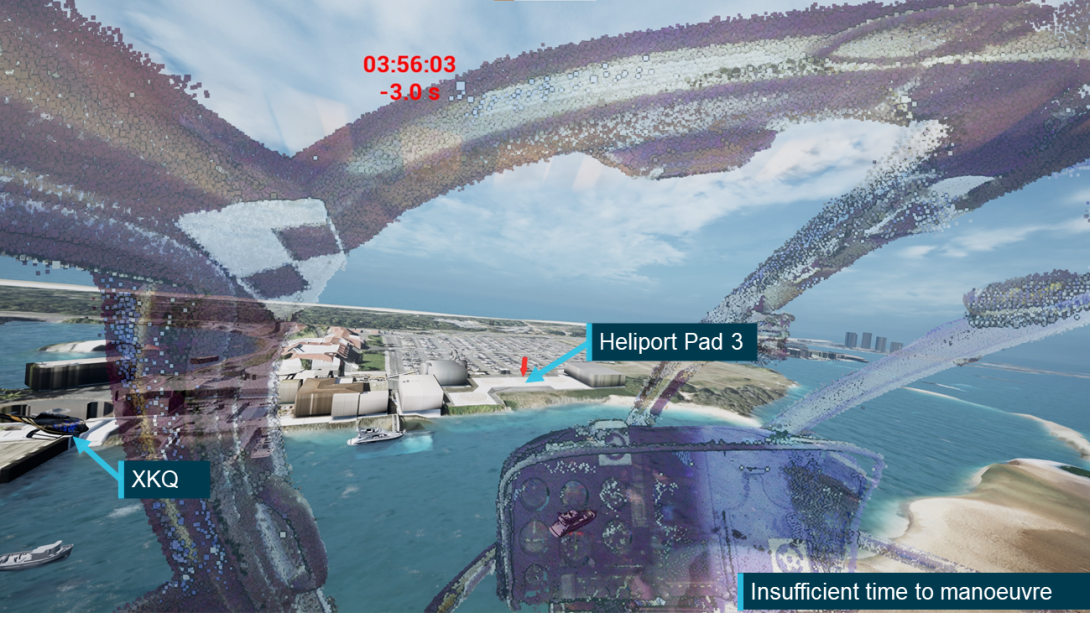
Source: IWI, annotated by the ATSB
XKQ
The following figures show the view from XKQ at several points in the lead‑up to the collision. To account for the location of XH9, images were captured both looking ahead and with the FOV rotated to the right to show the positioning of XH9 that lay outside of the 120° field of view shown by the animation screen. In images where XH9 appears behind the cockpit structure the transparency of the cockpit mask has been reduced so that the viewer can identify the aircraft where it is shielded by the structure. The pilot’s cap has also been simulated, shown as a blue transparent overlay on the visuals for the pilot. Where the view has been rotated it has been assumed that the eyes are rotated and not the head so the impact of the cap will be reduced. Table 6 shows the figure numbers of the images of the lead‑up to the collision and where these images fit in the sequence.
Table 6: XKQ animation departure figures
| Figure Number | Time (UTC) | Time to collision | Notes |
| Figure 133 | 03:55:42 | 24 seconds | XKQ lifts from the pad – looking forward |
| Figure 134 | 03:55:42 | 24 seconds | XKQ lifts from the pad – rotated right towards XH9 position |
| Figure 135 | 03:55:45 | 21 seconds | Last time XKQ is visible from XH9 – looking forward |
| Figure 136 | 03:55:45 | 21 seconds | Last time XKQ is visible from XH9 – looking right |
| Figure 137 | 03:55:51 | 15 seconds | Looking forward |
| Figure 138 | 03:55:51 | 15 seconds | Looking right |
| Figure 139 | 03:55:56 | 10 seconds | |
| Figure 140 | 03:55:59 | 07 seconds | |
| Figure 141 | 03:56:00 | 06 seconds | Upper bound limit of time for pilot to detect aircraft and react and manoeuvre to avoid collision |
| Figure 142 | 03:56:01 | 05 seconds | |
| Figure 143 | 03:56:03 | 03 seconds | Insufficient time to react and manoeuvre |
| N/A | 03:56:06 | 0 seconds | XKQ and XH9 collide |
Figure 133: Forward facing view from XKQ 24 seconds before collision
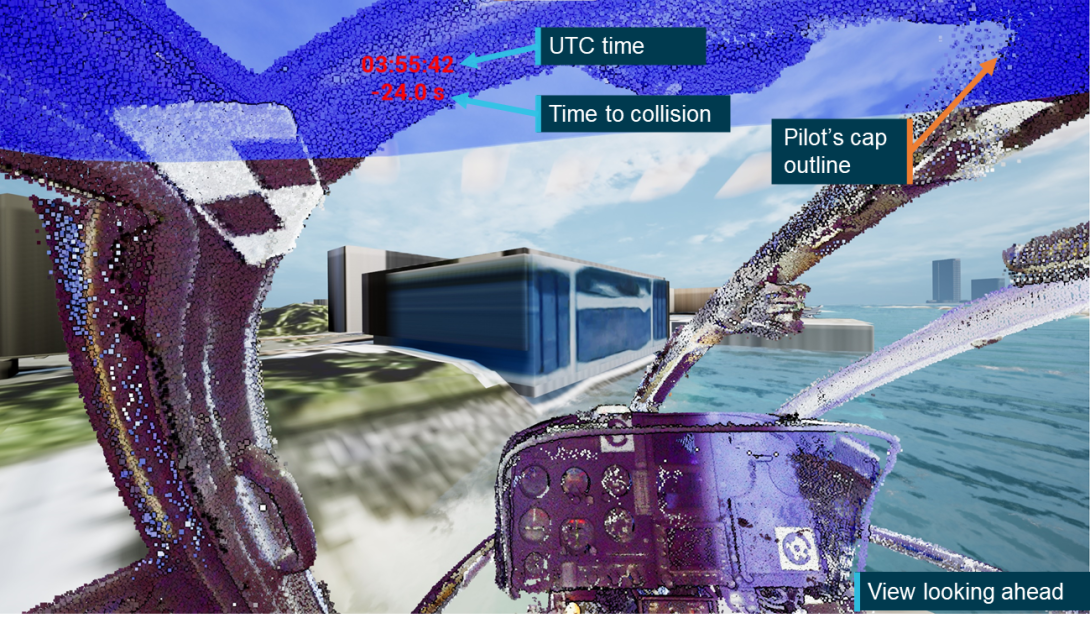
Source: IWI, annotated by the ATSB
Figure 134: Right facing view from XKQ 24 seconds before collision
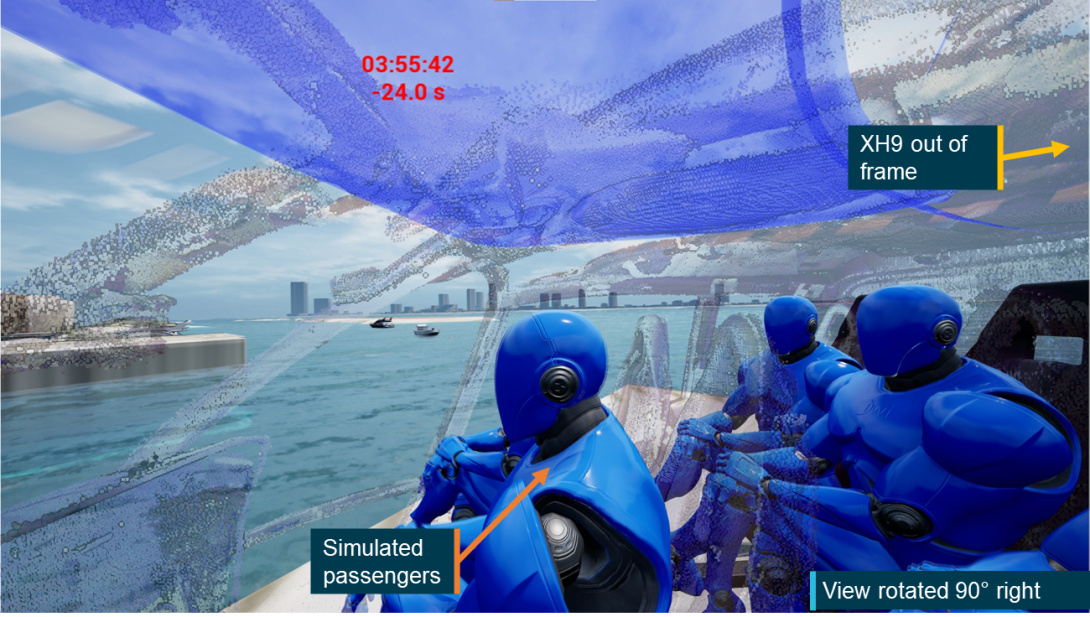
Source: IWI, annotated by the ATSB
Figure 135: Forward facing view from XKQ 21 seconds before collision
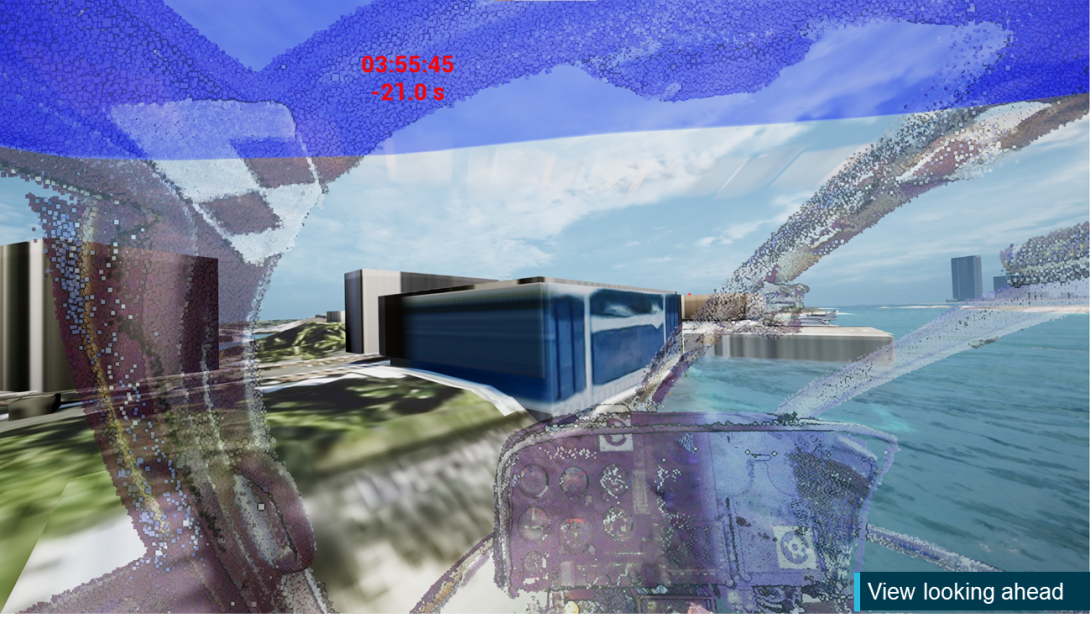
Source: IWI, annotated by the ATSB
Figure 136: Right facing view from XKQ 21 seconds before collision
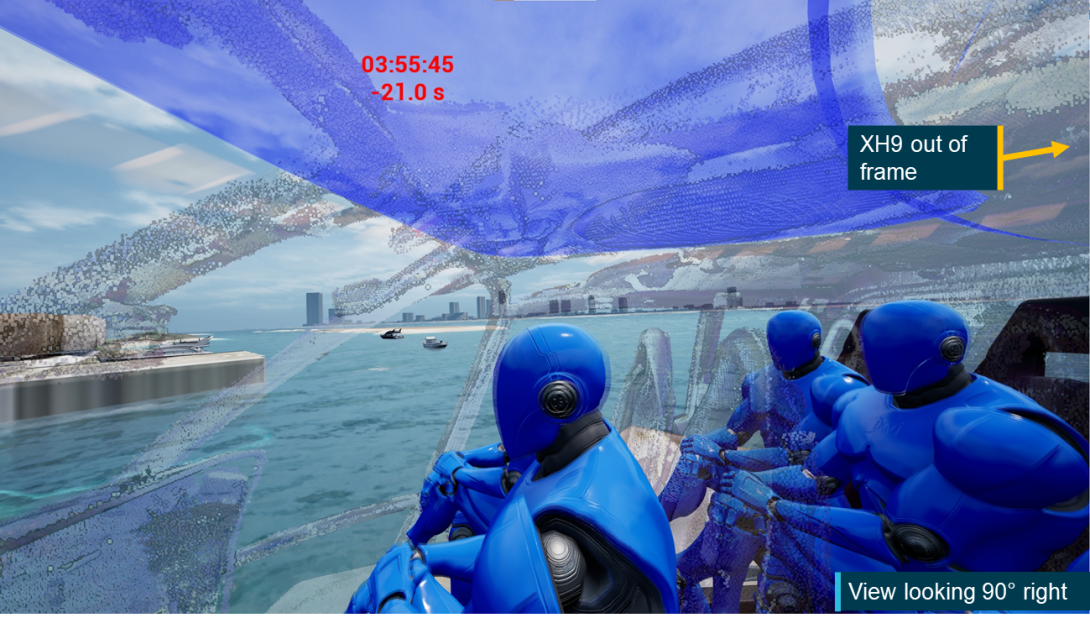
Source: IWI, annotated by the ATSB
Figure 137: Forward facing view from XKQ 15 seconds before collision
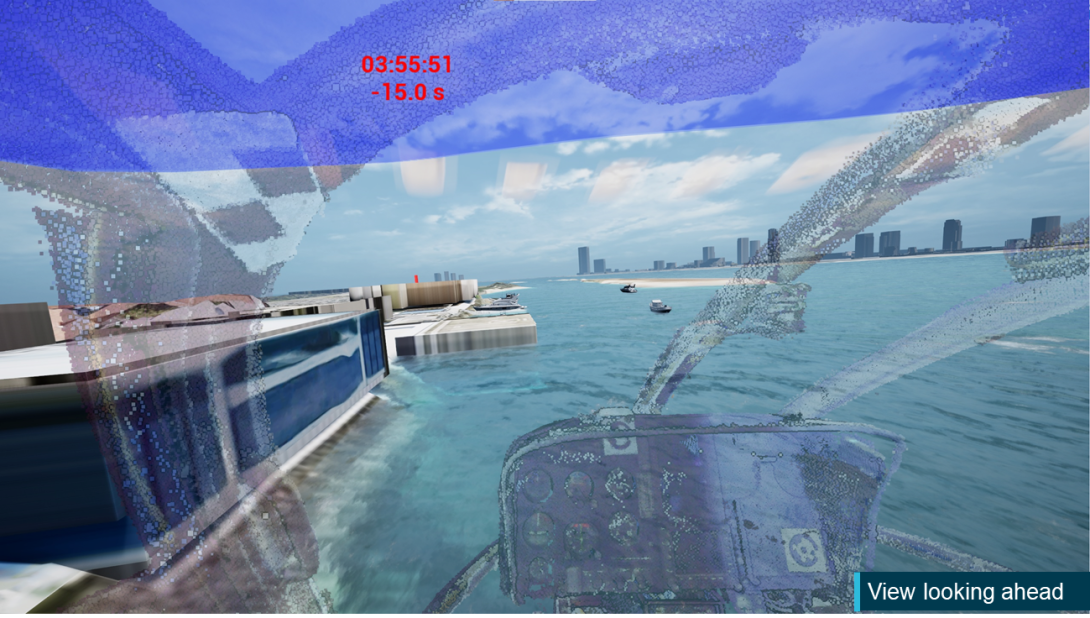
Source: IWI, annotated by the ATSB
Figure 138: Right facing view from XKQ 15 seconds before collision
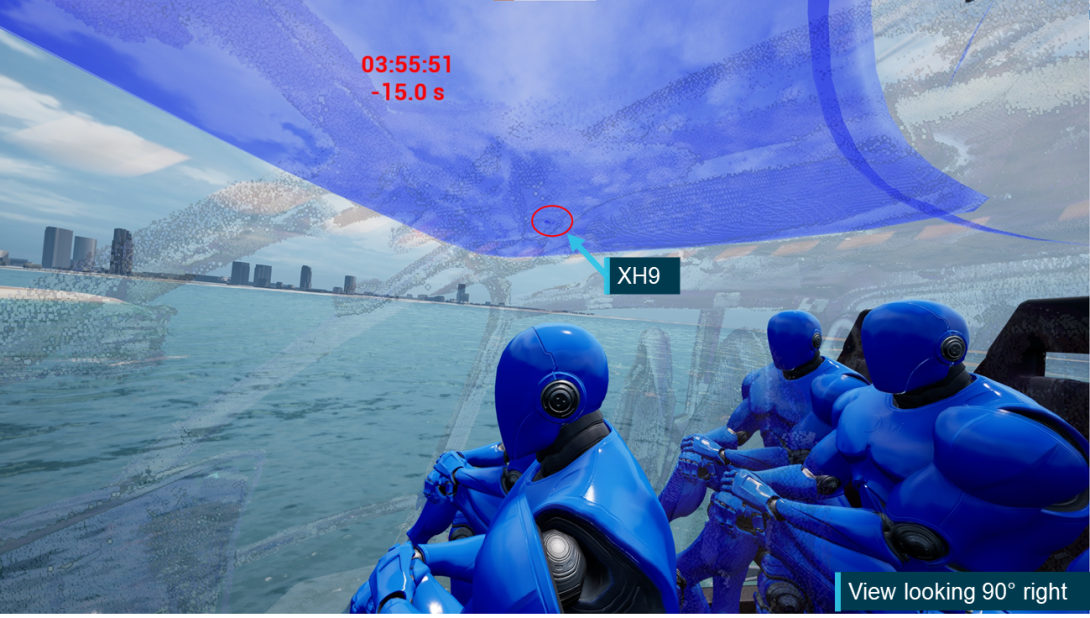
Source: IWI, annotated by the ATSB
Figure 139: View from XKQ 10 seconds before collision
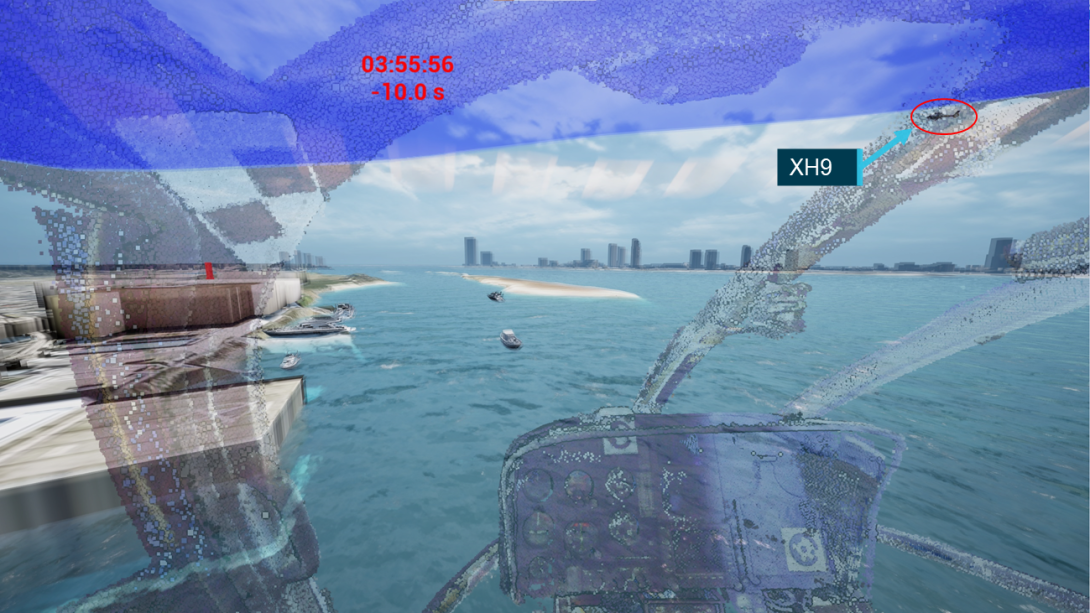
Source: IWI, annotated by the ATSB
Figure 140: View from XKQ 7 seconds before collision
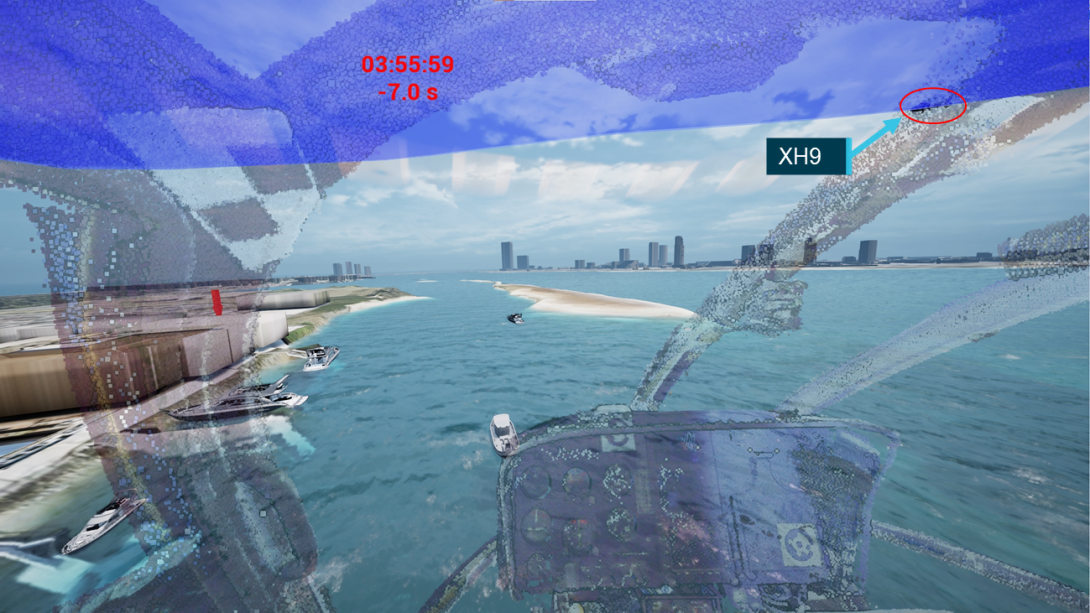
Source: IWI, annotated by the ATSB
Figure 141: View from XKQ 6 seconds before collision
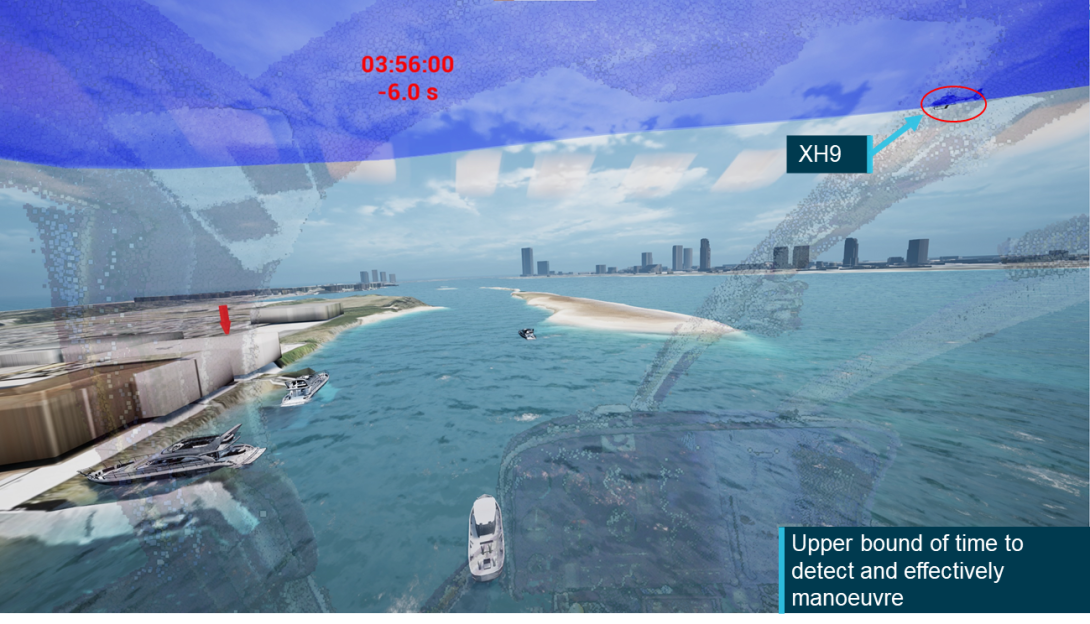
Source: IWI, annotated by the ATSB
Figure 142: View from XKQ 5 seconds before collision
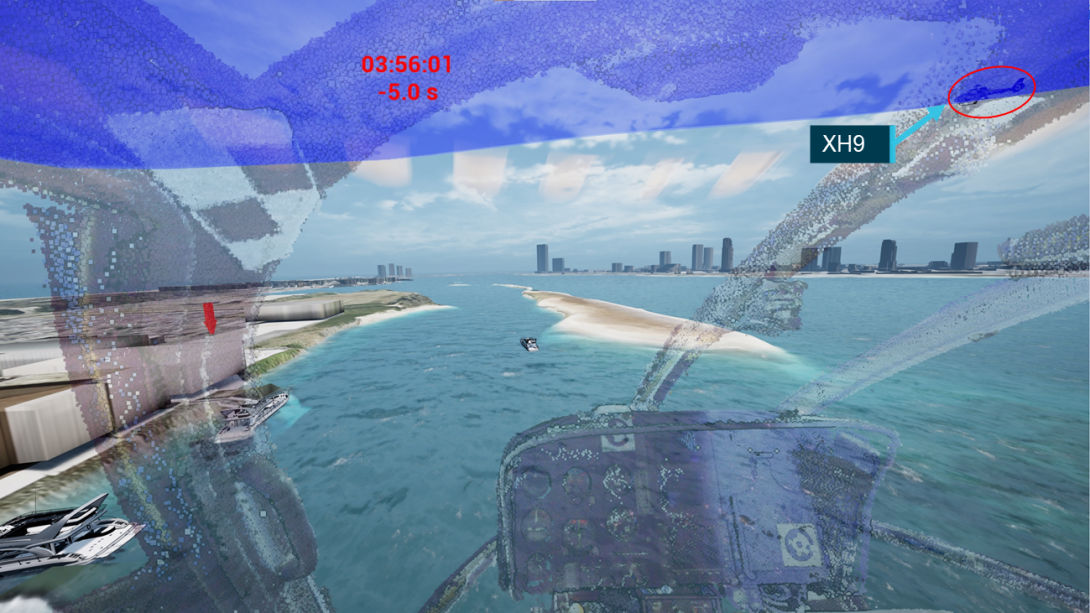
Source: IWI, annotated by the ATSB
Figure 143: View from XKQ 3 seconds before collision
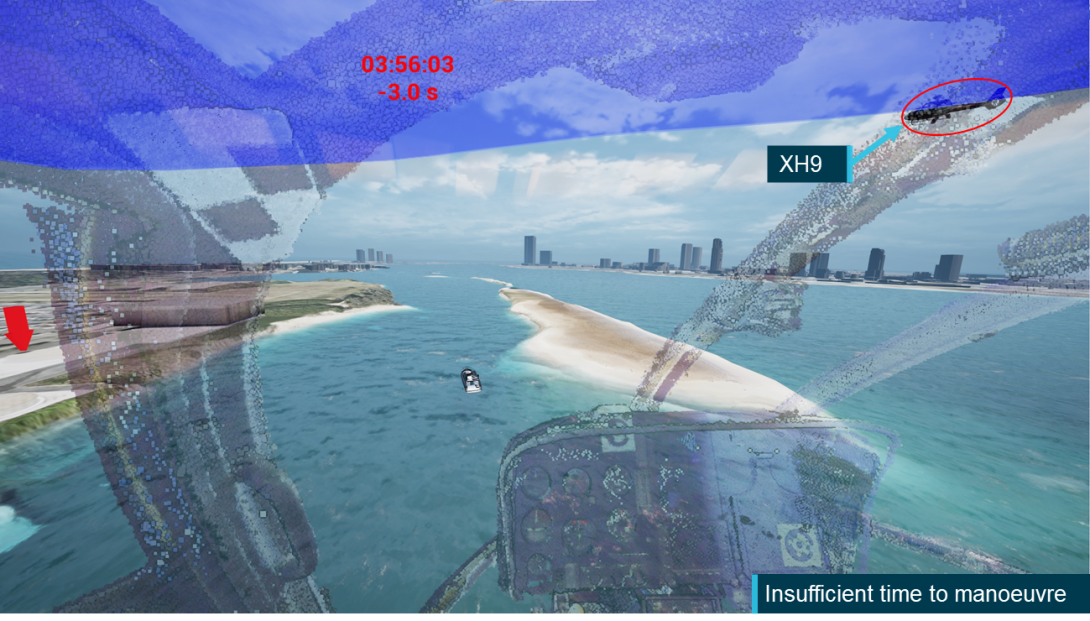
Source: IWI, annotated by the ATSB
Animation videos
As part of the development of the visibility study, 3 videos were specifically extracted from the animation environment. These videos show a 120-degree wide field of view from both aircraft during the lead-up to the accident. Relevant information around the development and limitations of these videos can be found in the Animation development section.
Video 1 shows the view from the pilot’s eye position of XH9 (the approaching aircraft) looking directly ahead from 03:55:27, 39 seconds before the collision.
Video 2 shows the view from pilot’s eye position of XKQ looking directly ahead from 03:55:27, 39 seconds before the accident.
Video 3 shows the view from the pilot’s eye position of XKQ. For this video the view has been rotated towards the right and the transparency of the cockpit structure has been decreased to allow the viewer to see objects that would have otherwise been obscured by the cockpit structure. This video starts from 03:55:41, 1 second before XKQ departs the park pad.
Conclusion
On 2 January 2023 VH‑XH9 and VH‑XKQ collided mid-air over the Gold Coast Broadwater adjacent to the Sea World theme park. In supporting the investigation, the ATSB sought to better understand the potential for visual acquisition for both pilots in the lead‑up to the collision. This analysis incorporated the following:
- Consideration of structure, position, orientation and relevant conspicuity and restraint equipment fitted to each aircraft.
- Detailed analysis of position and orientation data downloaded from each aircraft.
- Development of exemplar cockpit masks from the pilots’ estimated viewpoints and comparison with the relative location of the other aircraft.
- Review of the relative location of XH9 pilot's aiming point at the operator’s heliport and a pleasure craft the pilot was seeking to pass behind and XKQ.
- Consideration of human reaction times and visual performance limitations.
- Review of relevant witness and other local video sources.
- Environmental conditions at the time of the accident.
- Development of an animation representing the pilots’ views in the lead‑up to the collision.
Key conclusions
Based on this information, and within the limitations of the data available, the ATSB developed the following conclusions regarding the visual acquisition potential in the lead‑up to the accident.
- XH9 and XKQ collided at 03:56:06 UTC (13:56:06 local time) approximately 130 ft AMSL 150 m to the south and 90 m to the west of the park pad from which XKQ had departed 24 seconds earlier.
- The ATSB analysis indicated that for the pilot of XH9 (the arriving aircraft), XKQ was shielded from the pilot’s eye position between 11 and 6 seconds before the collision, with the aircraft partially unshielded 5 seconds before the collision. Prior to this time, when unshielded and after XKQ lifted off, lack of background contrast, minimal scene relative movement and relative power of the visible aircraft lighting against the ambient lighting would have limited detection opportunity. It has been estimated that the pilot of XH9 would have likely required between 4 and 6 seconds to react and manoeuvre to avoid the collision.
- Minor variation between the animation and the ATSB analysis due to the implementation of the 3D model and the visualisation of the ATSB data suggested a potential for XKQ to be partially or fully unshielded, outside of the left cockpit pillar, from the XH9 pilot’s eye position at least 5 seconds before the collision but up to 6 seconds, providing additional detection opportunity of up to 1 second.
- In the 20 seconds leading up to the collision, the relative location of the vessel that the pilot of XH9 was planning to pass behind and the pilot’s aiming point at pad 3 of the operator’s heliport were close to the centre of the pilot’s windscreen as viewed from the pilot’s eye position. Comparatively, XKQ appeared on the left edge of the pilot’s windscreen, then transitioned behind the pillar to the left window.
- For the pilot of XKQ (the departing aircraft), from 32 seconds before departure from the park pad until the collision, XH9 was shielded from the pilot’s eye position, first by the roof structure and then the left central cockpit pillar. Before this, the pilot of XKQ would have been required to turn to their body left and search for the target aircraft out the rear left window. However, XH9 was unlikely to have been a large enough visual size to be detectable to the pilot XKQ. This was due to the separation distance between the 2 aircraft and corresponding visual angle spanned.
- The geometry of the 2 flight paths and the aircraft lights and the target shielding meant that the approach and landing lights, which were the most powerful on each aircraft, would not have been visible and could not have been used to aid in the detection of the other aircraft.
- Sensitivity analysis completed on both pilots’ eye positions and rotations indicated that if either pilot had moved and rotated their head and eyes, consistent with a pilot searching for traffic, the opportunity for detection would have been altered due to changes in shielding of the target aircraft and where it appeared in the pilot’s field of view. Depending on which direction they rotated, this would have either improved or reduced the chance of detection.
- If the pilot of XH9 had moved their head between 30 and 50 mm to the left of the pilot’s eye position, XKQ would have been visible outside of the cockpit pillar for an additional 6 seconds. If they had leaned between 100 and 200 mm forward, XKQ would have appeared unobstructed within the pilot’s windscreen. In both cases to further increase the likelihood of detection these would have needed to be accompanied by rotation of the eyes to the left which would have placed XKQ more centrally in the field of view.
- The pilot of XKQ could have reduced the time that XH9 was shielded through 3 different independent movements either down, forward or to the left. To further improve detection opportunity these movements will also need to be accompanied by rotation of the pilot’s head up to eliminate interference from the pilot’s cap and a rotation of the pilot’s eyes up and to the right to place XH9 more centrally in the field of view.
- Due to the geometry of the cockpit and the approach profiles, the cap that the pilot of XKQ was wearing was unlikely to have had an impact on the detectability of XH9 from the pilot’s eye position. It did shield the pilot’s eyes from the sun likely improving their ability to sight and detect threats.
Glossary
| Abbreviation | Expanded Form | Definition (where applicable) |
|---|---|---|
| AC | Advisory Circular | In Australia – documents that provide advice and guidance to explain particular regulatory requirements of the Civil Aviation Safety Regulations 1998 (CASR) or associated Manual of Standards (MOS). In the United States – documents to provide guidance for compliance with airworthiness regulations, pilot certification, operational standards, training standards, and any other rules within the 14 CFR Aeronautics and Space Title. |
| AHRS | Attitude, Heading Reference System | |
| AEST | Australian Eastern Standard Time | Time zone of the accident universal coordinated time (UTC) +10 hours |
| AMM | Aircraft Maintenance Manual | |
| AMSL | Above Mean Sea Level | |
| Az | Azimuth Angle | |
| CCTV | Closed circuit Television | |
| DEP | Design Eye Position | Location within the aircraft identified by the manufacturer from where the cockpit it designed to be viewed. |
| EFB | Electronic Flight Bag Application | Electronic flight bags applications can electronically store and retrieve documents required for flight operations on a digital device, such as maps, charts, the Flight Crew Operations Manual, Minimum Equipment Lists and other control documents. |
| El | Elevation Angle | |
| FAA | Federal Aviation Administration | Aviation regulator of the United States |
| FAR | Federal Aviation Regulations | |
| ft | feet | measure of altitude |
| GNSS | Global Navigation Satellite System | Generic term for any satellite constellation that provides location, altitude or speed information to a receiver on the ground. The Global Positioning System (GPS) is an example. |
| GPS | Global Positioning System | United States GNSS constellation. |
| IWI | iwiation GmbH | Animation and data verification consultants for video based flight data reconstruction and pilots view visualization supporting human factor analysis. |
| kt | knots | measure of speed in nautical miles per hour |
| LED | Light Emitting Diode | |
| NM | Nautical Miles | measure of distance |
| NTSB | United States National Transportation Safety Board | Transportation safety investigation agency of the United States |
| STC | Supplemental Type Certificate | a type certificate (TC) issued when an applicant has received regulatory approval to modify an aeronautical product from its original design. |
| TC | Type Certificate | A regulators approval of the airworthiness of a particular aircraft or component design. |
| UTC | Universal Coordinated Time | Global Aviation time standard based on the time around 0° longitude. |
| VFR | Visual Flight Rules | a set of regulations that permit a pilot to operate an aircraft in visual meteorological conditions. |
| VMC | Visual Meteorological Conditions | |
| XH9 | VH-XH9 | Accident aircraft |
| XKQ | VH-XKQ | Accident aircraft |
| XKK | VH-XKK | Exemplar aircraft for XH9 and XKQ |
Sources and submissions
Sources of information
The sources of information during the investigation included:
- Sea World Helicopters
- the pilot of XH9
- the Civil Aviation Safety Authority
- the Federal Aviation Administration
- Geoscience Australia
- the Queensland Police Service
- SpiderTracks
- Airbus Helicopters
- iwiation GmbH
- the SpiderX units from on board the aircraft
- video footage of the accident flight and other photographs and videos taken on the day of the accident
References
AeroLEDS. (2021). SUNSPOT 36-4000 TECHNICAL SPECIFICATIONS. Retrieved from AeroLEDS: https://aeroleds.com/products/sunspot-36-4000-landing-light/
ATSB. (2002). AVIATION SAFETY INVESTIGATION REPORT 200201846 - Piper PA-28-161, VH-IBK, Socata TB-9, VH-JTV, Bankstown Airport, NSW, 5 May 2002. Canberra: ATSB.
Bhise, V. D. (2012). Ergonomics in the Automotive Design Process. Boca Raton: CRC Press.
Boff, K. R., & Lincoln, J. E. (1988). Engineering Data Compendium: Human Perception and Performance. Dayton: Harry G. Armstrong Aerospace Medical Research Laboratory.
Bullough, J. D. (2011). Aviation Signal Lighting: Impacts of Lighting Charactaristics on Visibility. Advances in Applied Science Research, 16-26.
Colvin, K., Dodhia, R., & Dismukes, R. K. (2005). Is Pilots Scanning Adequate to Avoid Mid-Air Collisions? International Symposium on Aviation Psychology, (pp. 141-146). Dayton.
FAA. (2017). Scanning for Other Aircraft. In FAA, Aeronautical Information Manual (pp. 8-1-7). Washington DC: Department of Transportation.
FAA. (2020). Night Operations - Aircraft Lighting and Equipment. In FAA, FAA Airplane Flying Handbook (pp. 10-5). Washington DC: US Department of Tranportation.
FAA Civil Aerospace Medical Institute. (2015). Sunglasses for Pilots: Beyond the Image. Oklahoma City OK: Federal Aviaition Administration.
Franchak, J. M., McGee, B., & Blanch, G. (2021). Adapting the coordination of eyes and head to differences in take and environment during fully-mobile visual exploration. PLOS One, 1-17.
Gibb, R., Gray, R., & Scharff, L. (2010). Aviation Visual Perception. Surrey: Ashgate Publishing Limited.
Hadjikhani, N., & Tootell, R. B. (2000). Projection of Rods and Cones Within Human Visual Cortex. Human Brain Mapping(9 (1)), 55-63.
Hobbs, A. (2004). Limitiations of the See-and-Avoid Principle. Canberra: Australian Transport Safety Bureau.
Isik, O. K., Hong, J., Petrunin, I., & Tsourdos, A. (2020). Integrity Analysis for GPS-Based Navigation of UAVs. Robotics, 66.
Parker, J. F., & West, V. R. (1973). BioAstronautics Data Book. Washington D.C.: National Aeronautics and Space Adminstration.
Poppel, E., & Harvey, Jr, L. O. (1973). Light-difference threshold and subjective brightness in the periphery of the visual field. Psychologische Forschung, 36(2), 145–161.
Strasburger, H., Rentschler, I., & Juttner, M. (2011). Peripheral vision and pattern recognition: A review. Journal of Vision, 1-84.
US DOE. (2022, March 25). LED Lighting. Retrieved from United States Department of Energy - Energy Saver: https://www.energy.gov/energysaver/led-lighting
Wolfe, B., Dobres, J., Rosenholtz, R., & Reimer, B. (2017). More than the Useful Field: Considering peripheral vision in driving. Applied Ergonomics - Huma Factors in Technology and Society, 316-325.
Submissions
Under section 26 of the Transport Safety Investigation Act 2003, the ATSB may provide a draft report, on a confidential basis, to any person whom the ATSB considers appropriate. That section allows a person receiving a draft report to make submissions to the ATSB about the draft report.
A draft of this report was provided to the following relevant parties:
- National Transport Safety Board of the United States
- iwiation GmbH
Submissions were received from:
- National Transport Safety Board of the United States
- iwiation GmbH
The submissions were reviewed and, where considered appropriate, the text of the report was amended accordingly.
Purpose of safety investigationsThe objective of a safety investigation is to enhance transport safety. This is done through:
It is not a function of the ATSB to apportion blame or provide a means for determining liability. At the same time, an investigation report must include factual material of sufficient weight to support the analysis and findings. At all times the ATSB endeavours to balance the use of material that could imply adverse comment with the need to properly explain what happened, and why, in a fair and unbiased manner. The ATSB does not investigate for the purpose of taking administrative, regulatory or criminal action. TerminologyAn explanation of terminology used in ATSB investigation reports is available here. This includes terms such as occurrence, contributing factor, other factor that increased risk, and safety issue. Publishing informationReleased in accordance with section 25 of the Transport Safety Investigation Act 2003 Published by: Australian Transport Safety Bureau © Commonwealth of Australia 2025
Ownership of intellectual property rights in this publication Unless otherwise noted, copyright (and any other intellectual property rights, if any) in this report publication is owned by the Commonwealth of Australia. Creative Commons licence With the exception of the Commonwealth Coat of Arms, ATSB logo, and photos and graphics in which a third party holds copyright, this report is licensed under a Creative Commons Attribution 4.0 International licence. The CC BY 4.0 licence enables you to distribute, remix, adapt, and build upon our material in any medium or format, so long as attribution is given to the Australian Transport Safety Bureau. Copyright in material obtained from other agencies, private individuals or organisations, belongs to those agencies, individuals or organisations. Where you wish to use their material, you will need to contact them directly. |
[1] Eurocopter became Airbus Helicopters in 2014. The Eurocopter EC130 series is now sold as the Airbus Helicopters H130.
[2] Collaboration with iwiation GmbH was in accordance with the International Civil Aviation Organization Annex 13 through an accredited representative from Bureau d'Enquêtes et d'Analyses pour la sécurité de l'aviation civile (BEA) (France).
[3] Air transport replaced the term charter and is conducted for hire or reward.
[4] The candela (cd) is the unit for luminous intensity of the International System of Units (SI). It measures the luminous power emitted by a light source. One candela is roughly equivalent to the luminous intensity of a wax candle.
[5] Skylights were panels installed above the pilot and the right front passenger’s seat that improved visibility above the aircraft and let additional light into the cockpit.
[6] Dappled surface: consistent pattern where small holes are punched into a sheet of solid material to enable enough light and visibility that the viewer can create the whole picture but the amount of light entering is reduced. This is the same coating that allows for advertisements to be placed over the windows of transport vehicles while the passengers inside can still effectively see out the window.
[7] FARO Scene 2019 version was used for merging the scan data and processing the models.
[8] An equirectangular image is where a 360-degree image is projected onto a flat 2D surface with equal azimuth and elevation angle.
[9] A mathematical process that converts from one 3-dimensional coordinate system to another through a sequence of axis translations (linear movements in space) and ordered rotations about each axis.
[10] An AHRS consists of a set of gyroscopes, accelerometers, and magnetometers around three axes that compute an aircraft’s orientation parameters (roll, pitch and yaw or heading).
[11] A Kalman filter is a mathematical model used to estimate the actual value of a variable based on a noisy data set including statistical noise and other inaccuracies.
[12] PDOP is a measure of confidence in the precision of a GNSS position reported based on the geometry of the satellites the receiver is connected to.
[13] The solar position calculator gives Azimuth and Elevation angles relative to a position on the earth’s surface, the minor variation with aircraft altitude can then be trigonometrically accounted for.
[14] Luminance is a measure of the intensity of light reflected (illuminance) or emitted (luminance) by a body.
[15] The parameter that is referred to as visual angle throughout this report has been referenced as ‘angular size’ in other ATSB publications AS-2022-001 and AO-2023-024.
[16] Due to the limited visible surface the helicopter’s landing gear and mast have not been included in the calculation of fuselage height.
[17] This length corresponds to an aircraft that has had Mod-074581 implemented (refer Development of the 3-dimensional model for further information).
[18] This research defined the angular speed required to detect movement. It did not define an angular speed that would be able to draw the attention of the viewer, which would be expected to be higher.
[19] Previous ATSB visibility study AS-2022-001 referred to the foveal region as 10 degrees of the visual field. This value was selected to include the fovea and para-fovea which surrounds the Fovea (Strasburger, Rentschler, & Juttner, 2011). For the purposes of this report the Foveal area has been reduced to include only the central fovea.
[20] Visual Trap – When the viewers gaze becomes focused on a particular object in the foreground of the field of view neglecting objects in the distance. For example, a pilot becoming focused on a blemish on the windscreen rather than scanning the whole visual field for traffic.
[21] High‑visibility coating is only applied to the upper surface of the rotor blades as to coat the lower surfaces increases the risk of the pilot flying the helicopter experiencing flicker vertigo.
[22] Due to the shutter speed of the camera on the still images presented the blades do not show as the concentric circles described. To an observer watching the rotating blade the motion will create the appearance of concentric circles.
[23] Geoscience Australia’s Geodetic calculators can be found at Geodetic Calculators (ga.gov.au).
[24] Figure 28, Figure 29 and Figure 30 are presented in metres to ensure ease of cross reference between the lateral, vertical and total proximity.
[25] ICAO Annex 13 establishes the standards and recommended practices for accident investigations by states (countries) and coordination between them.